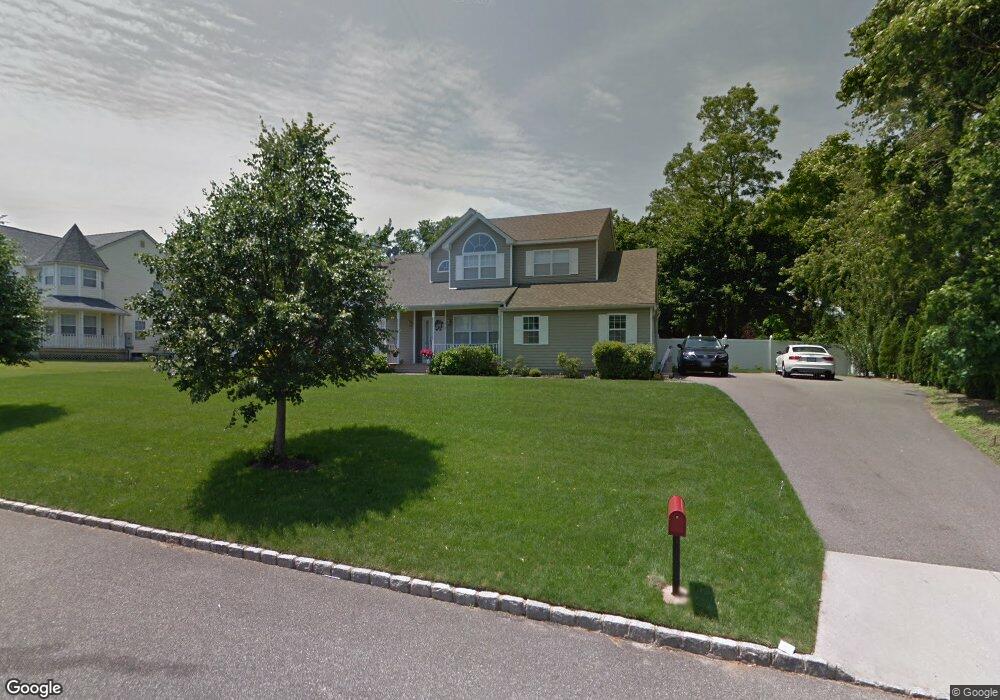
4 Briarberry Ct Lake Grove, NY 11755
Estimated Value: $815,000 - $1,010,000
4
Beds
3
Baths
2,906
Sq Ft
$323/Sq Ft
Est. Value
About This Home
This home is located at 4 Briarberry Ct, Lake Grove, NY 11755 and is currently estimated at $938,073, approximately $322 per square foot. 4 Briarberry Ct is a home located in Suffolk County with nearby schools including Our Savior New American School.
Ownership History
Date
Name
Owned For
Owner Type
Purchase Details
Closed on
Dec 22, 2015
Sold by
Rutman Mathew and Rutman Socorro
Bought by
Lursen Thomas and Lursen Joanne
Current Estimated Value
Purchase Details
Closed on
Jul 24, 2006
Sold by
Gultz Anna
Bought by
Rutman Mathew
Purchase Details
Closed on
Feb 13, 2003
Sold by
Deerfield Homes Inc
Bought by
Gultz Anna
Home Financials for this Owner
Home Financials are based on the most recent Mortgage that was taken out on this home.
Original Mortgage
$327,400
Interest Rate
5.98%
Create a Home Valuation Report for This Property
The Home Valuation Report is an in-depth analysis detailing your home's value as well as a comparison with similar homes in the area
Home Values in the Area
Average Home Value in this Area
Purchase History
| Date | Buyer | Sale Price | Title Company |
|---|---|---|---|
| Lursen Thomas | $425,000 | None Available | |
| Rutman Mathew | $690,000 | Marc Blaustein | |
| Gultz Anna | $409,260 | Fidelity National Title Ins |
Source: Public Records
Mortgage History
| Date | Status | Borrower | Loan Amount |
|---|---|---|---|
| Previous Owner | Gultz Anna | $327,400 |
Source: Public Records
Tax History Compared to Growth
Tax History
| Year | Tax Paid | Tax Assessment Tax Assessment Total Assessment is a certain percentage of the fair market value that is determined by local assessors to be the total taxable value of land and additions on the property. | Land | Improvement |
|---|---|---|---|---|
| 2024 | $21,309 | $4,850 | $400 | $4,450 |
| 2023 | $19,919 | $4,850 | $400 | $4,450 |
| 2022 | $19,271 | $4,850 | $400 | $4,450 |
| 2021 | $19,271 | $4,850 | $400 | $4,450 |
| 2020 | $20,990 | $4,850 | $400 | $4,450 |
| 2019 | $20,922 | $0 | $0 | $0 |
| 2018 | $18,631 | $5,200 | $400 | $4,800 |
| 2017 | $18,631 | $5,200 | $400 | $4,800 |
| 2016 | $18,578 | $5,200 | $400 | $4,800 |
| 2015 | -- | $5,200 | $400 | $4,800 |
| 2014 | -- | $5,200 | $400 | $4,800 |
Source: Public Records
Map
Nearby Homes