Estimated Value: $351,758 - $364,000
2
Beds
1
Bath
1,168
Sq Ft
$304/Sq Ft
Est. Value
About This Home
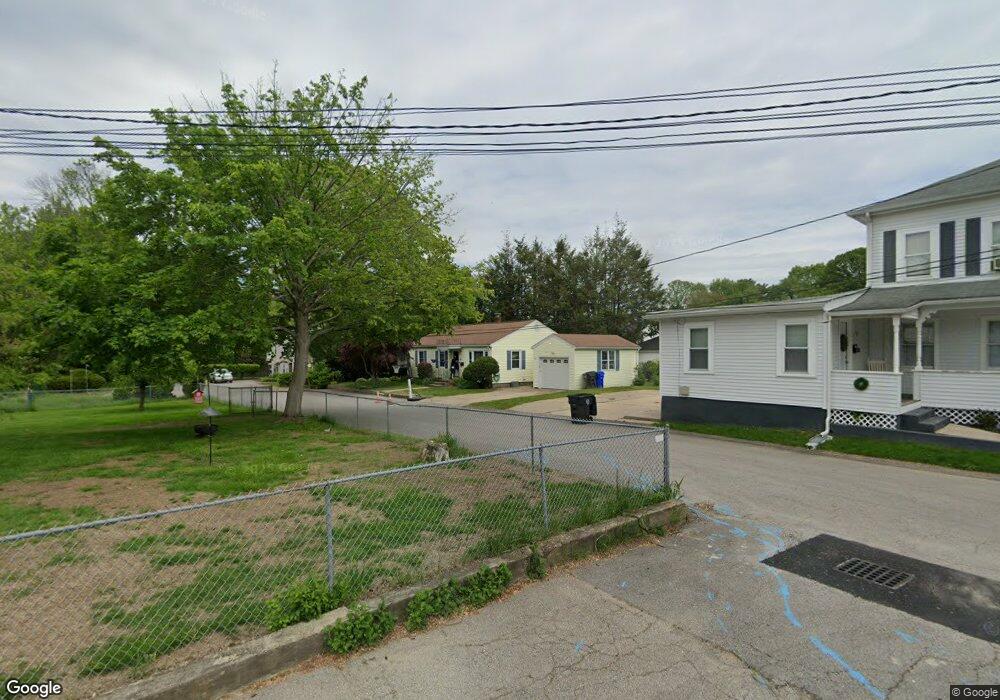
This home is located at 4 Brook Ln, West Warwick, RI 02893 and is currently estimated at $354,940, approximately $303 per square foot. 4 Brook Ln is a home located in Kent County with nearby schools including West Warwick High School.
Ownership History
Date
Name
Owned For
Owner Type
Purchase Details
Closed on
Sep 8, 2023
Sold by
Neishel David P and Neishel Lauren
Bought by
Neishel David P and Neishel Lauren
Current Estimated Value
Home Financials for this Owner
Home Financials are based on the most recent Mortgage that was taken out on this home.
Original Mortgage
$225,000
Outstanding Balance
$220,228
Interest Rate
6.96%
Mortgage Type
Stand Alone Refi Refinance Of Original Loan
Estimated Equity
$134,712
Purchase Details
Closed on
May 14, 2004
Sold by
Burgess John W and Burgess Angela P
Bought by
Neishel David P and Peterson Lauren
Home Financials for this Owner
Home Financials are based on the most recent Mortgage that was taken out on this home.
Original Mortgage
$168,300
Interest Rate
5.47%
Mortgage Type
Purchase Money Mortgage
Purchase Details
Closed on
Sep 14, 1999
Sold by
Norwest Financial Ri
Bought by
Burgess John W and Burgess Angela
Create a Home Valuation Report for This Property
The Home Valuation Report is an in-depth analysis detailing your home's value as well as a comparison with similar homes in the area
Home Values in the Area
Average Home Value in this Area
Purchase History
| Date | Buyer | Sale Price | Title Company |
|---|---|---|---|
| Neishel David P | -- | None Available | |
| Neishel David P | -- | None Available | |
| Neishal David P | -- | None Available | |
| Neishel David P | $177,500 | -- | |
| Burgess John W | $76,500 | -- | |
| Neishel David P | $177,500 | -- | |
| Burgess John W | $76,500 | -- |
Source: Public Records
Mortgage History
| Date | Status | Borrower | Loan Amount |
|---|---|---|---|
| Open | Neishal David P | $225,000 | |
| Closed | Neishel David P | $225,000 | |
| Previous Owner | Burgess John W | $168,300 |
Source: Public Records
Tax History
| Year | Tax Paid | Tax Assessment Tax Assessment Total Assessment is a certain percentage of the fair market value that is determined by local assessors to be the total taxable value of land and additions on the property. | Land | Improvement |
|---|---|---|---|---|
| 2025 | $3,834 | $268,300 | $52,800 | $215,500 |
| 2024 | $3,973 | $212,600 | $41,500 | $171,100 |
| 2023 | $3,895 | $212,600 | $41,500 | $171,100 |
| 2022 | $3,835 | $212,600 | $41,500 | $171,100 |
| 2021 | $3,816 | $165,900 | $41,500 | $124,400 |
| 2020 | $3,816 | $165,900 | $41,500 | $124,400 |
| 2019 | $4,864 | $165,900 | $41,500 | $124,400 |
| 2018 | $3,436 | $126,400 | $41,500 | $84,900 |
| 2017 | $3,326 | $126,400 | $41,500 | $84,900 |
| 2016 | $3,266 | $126,400 | $41,500 | $84,900 |
| 2015 | $3,087 | $118,900 | $41,500 | $77,400 |
| 2014 | $3,019 | $118,900 | $41,500 | $77,400 |
Source: Public Records
Map
Nearby Homes
Your Personal Tour Guide
Ask me questions while you tour the home.