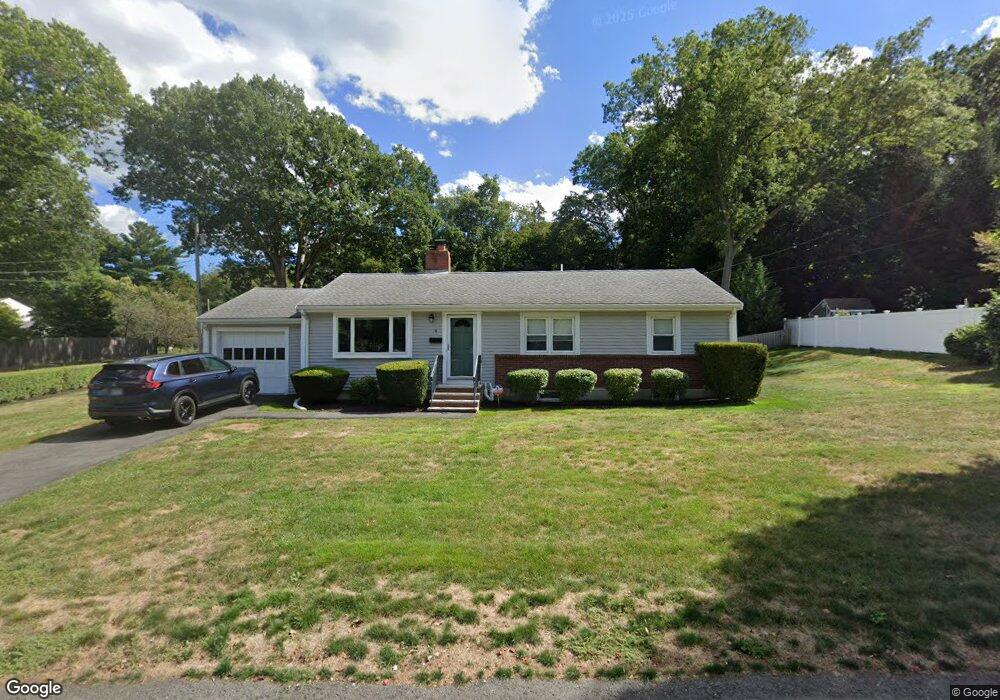
4 Bulow Rd Hingham, MA 02043
Estimated Value: $402,000 - $1,009,000
3
Beds
2
Baths
1,080
Sq Ft
$726/Sq Ft
Est. Value
About This Home
This home is located at 4 Bulow Rd, Hingham, MA 02043 and is currently estimated at $784,401, approximately $726 per square foot. 4 Bulow Rd is a home located in Plymouth County with nearby schools including William L. Foster Elementary School, Hingham Middle School, and Hingham High School.
Ownership History
Date
Name
Owned For
Owner Type
Purchase Details
Closed on
Jan 3, 2026
Sold by
Booth Carol J
Bought by
Carol J Booth T J and Carol Booth
Current Estimated Value
Purchase Details
Closed on
Oct 6, 2025
Sold by
Booth Carol J and Finn Janet M
Bought by
Booth Carol J
Home Financials for this Owner
Home Financials are based on the most recent Mortgage that was taken out on this home.
Original Mortgage
$400,000
Interest Rate
6.56%
Mortgage Type
New Conventional
Purchase Details
Closed on
Feb 5, 2025
Sold by
Sweeney Ft and Booth
Bought by
Booth Carol J and Finn Janet M
Create a Home Valuation Report for This Property
The Home Valuation Report is an in-depth analysis detailing your home's value as well as a comparison with similar homes in the area
Purchase History
| Date | Buyer | Sale Price | Title Company |
|---|---|---|---|
| Carol J Booth T J | -- | -- | |
| Booth Carol J | $400,000 | -- | |
| Booth Carol J | -- | None Available | |
| Booth Carol J | -- | None Available |
Source: Public Records
Mortgage History
| Date | Status | Borrower | Loan Amount |
|---|---|---|---|
| Previous Owner | Booth Carol J | $400,000 |
Source: Public Records
Tax History
| Year | Tax Paid | Tax Assessment Tax Assessment Total Assessment is a certain percentage of the fair market value that is determined by local assessors to be the total taxable value of land and additions on the property. | Land | Improvement |
|---|---|---|---|---|
| 2025 | $6,600 | $617,400 | $393,500 | $223,900 |
| 2024 | $6,579 | $606,400 | $393,500 | $212,900 |
| 2023 | $6,009 | $600,900 | $393,500 | $207,400 |
| 2022 | $5,765 | $498,700 | $339,500 | $159,200 |
| 2021 | $5,659 | $479,600 | $339,500 | $140,100 |
| 2020 | $5,530 | $479,600 | $339,500 | $140,100 |
| 2019 | $5,568 | $471,500 | $339,500 | $132,000 |
| 2018 | $185 | $389,500 | $262,300 | $127,200 |
| 2017 | $4,768 | $389,200 | $262,000 | $127,200 |
| 2016 | $4,705 | $376,700 | $249,500 | $127,200 |
| 2015 | $4,359 | $347,900 | $220,700 | $127,200 |
Source: Public Records
Map
Nearby Homes
- 43 Park View Dr
- 151 Stayner Dr Unit 151
- 132 Hms Stayner Dr Unit 132
- 34 Otis Hill Rd
- 6 Adams Ct
- 225 South St Unit 1
- 12 Daley Rd
- 18 West St
- 21 Hersey St
- 16 Foley Beach Rd
- 17 Paige St
- 81 Kimball Beach Rd
- 22 Del Prete Dr
- 19 Lantern Ln
- 2 Beach Ln
- 130 Broad Reach Unit 206
- 73 Broad Reach Unit M36C
- 73 Broad Reach Unit M21C
- 51 Broad Reach Unit T23A
- 64 Broad Reach Unit 310
Your Personal Tour Guide
Ask me questions while you tour the home.