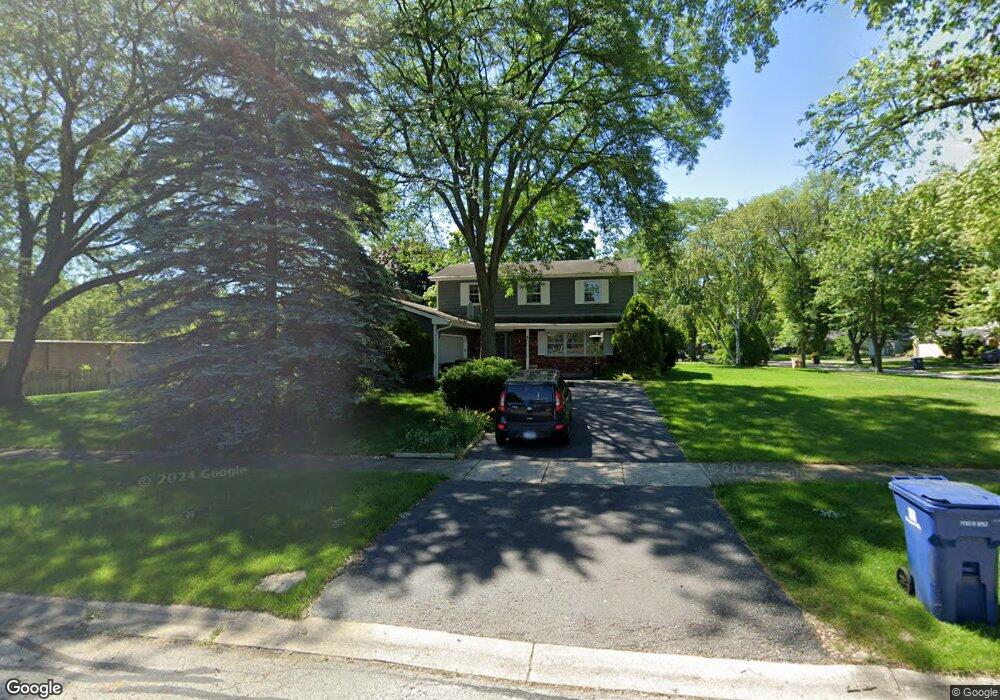
4 Bunting Ln Naperville, IL 60565
Maple Brook NeighborhoodEstimated Value: $485,445 - $602,000
5
Beds
4
Baths
2,376
Sq Ft
$228/Sq Ft
Est. Value
About This Home
This home is located at 4 Bunting Ln, Naperville, IL 60565 and is currently estimated at $540,611, approximately $227 per square foot. 4 Bunting Ln is a home located in DuPage County with nearby schools including Maplebrook Elementary School, Lincoln Jr. High School, and Naperville Central High School.
Ownership History
Date
Name
Owned For
Owner Type
Purchase Details
Closed on
Feb 23, 2006
Sold by
Wangombe Baru and Wangombe Grace
Bought by
Zbylut James E and Lawrisuk Alexia F
Current Estimated Value
Home Financials for this Owner
Home Financials are based on the most recent Mortgage that was taken out on this home.
Original Mortgage
$266,400
Outstanding Balance
$144,445
Interest Rate
5.87%
Mortgage Type
Purchase Money Mortgage
Estimated Equity
$396,166
Purchase Details
Closed on
Jun 25, 1999
Sold by
Kurtenbach Chris A and Kurtenbach June A
Bought by
Wangombe Baru and Wangombe Grace
Home Financials for this Owner
Home Financials are based on the most recent Mortgage that was taken out on this home.
Original Mortgage
$205,200
Interest Rate
7.29%
Purchase Details
Closed on
Nov 28, 1994
Sold by
Schuelke Richard and Schuelke Kandis M
Bought by
Kurtenbach Chris A and Kurtenbach June A
Home Financials for this Owner
Home Financials are based on the most recent Mortgage that was taken out on this home.
Original Mortgage
$120,000
Interest Rate
9.06%
Create a Home Valuation Report for This Property
The Home Valuation Report is an in-depth analysis detailing your home's value as well as a comparison with similar homes in the area
Home Values in the Area
Average Home Value in this Area
Purchase History
| Date | Buyer | Sale Price | Title Company |
|---|---|---|---|
| Zbylut James E | $333,000 | Chicago Title Insurance Comp | |
| Wangombe Baru | $216,000 | -- | |
| Kurtenbach Chris A | $172,000 | -- |
Source: Public Records
Mortgage History
| Date | Status | Borrower | Loan Amount |
|---|---|---|---|
| Open | Zbylut James E | $266,400 | |
| Previous Owner | Wangombe Baru | $205,200 | |
| Previous Owner | Kurtenbach Chris A | $120,000 |
Source: Public Records
Tax History
| Year | Tax Paid | Tax Assessment Tax Assessment Total Assessment is a certain percentage of the fair market value that is determined by local assessors to be the total taxable value of land and additions on the property. | Land | Improvement |
|---|---|---|---|---|
| 2024 | $8,229 | $142,321 | $66,882 | $75,439 |
| 2023 | $7,920 | $129,890 | $61,040 | $68,850 |
| 2022 | $7,617 | $123,700 | $58,130 | $65,570 |
| 2021 | $7,336 | $119,020 | $55,930 | $63,090 |
| 2020 | $7,178 | $116,880 | $54,920 | $61,960 |
| 2019 | $6,965 | $111,820 | $52,540 | $59,280 |
| 2018 | $6,787 | $109,090 | $51,260 | $57,830 |
| 2017 | $6,648 | $105,410 | $49,530 | $55,880 |
| 2016 | $6,512 | $101,600 | $47,740 | $53,860 |
| 2015 | $6,465 | $95,680 | $44,960 | $50,720 |
| 2014 | $6,336 | $91,120 | $42,820 | $48,300 |
| 2013 | $6,241 | $91,340 | $42,920 | $48,420 |
Source: Public Records
Map
Nearby Homes
- 1532 Swallow St
- 77 Bluebird Ln
- 8S452 Bell Dr
- 1583 Orchard Cir
- 510 Harlowe Ln Unit 2001C
- 1546 Treeline Ct Unit 405
- 1449 Whitespire Ct Unit 5104
- 124 E Bailey Rd Unit E
- 1678 Cove Ct Unit 5
- 538 Harlowe Ln Unit 1801
- 289 Winding Creek Dr
- 1751 S Washington St Unit 1
- 1204 Hobson Oaks Ct Unit 1204
- 1710 Coach Dr
- 48 Starling Ln
- 628 Flock Ave Unit 3
- 1715 Amelia Ct
- 332 Prairie Knoll Dr
- 621 Bourbon Ct
- 308 Tamarack Ave
- 1344 Swallow St
- 1337 Swallow St
- 1341 Swallow St
- 1412 Swallow St
- 1405 Swallow St
- 8 Bunting Ln
- 1409 Swallow St
- 1416 Swallow St
- 1413 Swallow St
- 1340 Killdeer Dr
- 1330 Killdeer Dr
- 1420 Swallow St
- 1336 Killdeer Dr
- 1404 Killdeer Dr
- 1417 Swallow St
- 1408 Killdeer Dr
- 1412 Killdeer Dr
- 1424 Swallow St
- 1421 Swallow St
- 17 Bunting Ln
Your Personal Tour Guide
Ask me questions while you tour the home.