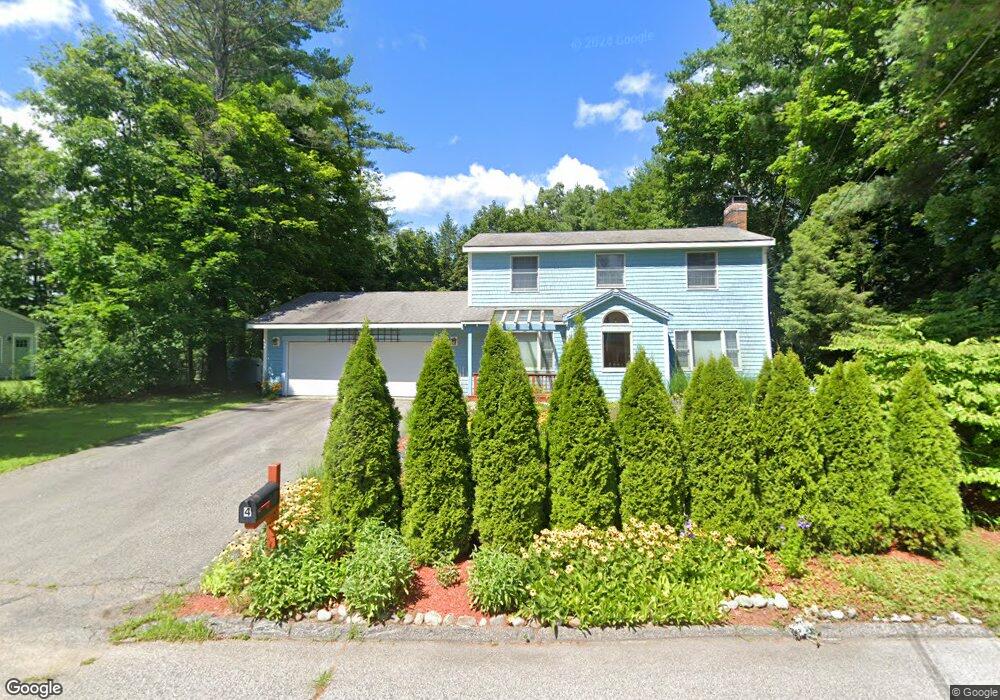
4 Burnham Ave Durham, NH 03824
Estimated Value: $650,297 - $887,000
4
Beds
4
Baths
2,288
Sq Ft
$321/Sq Ft
Est. Value
About This Home
This home is located at 4 Burnham Ave, Durham, NH 03824 and is currently estimated at $734,574, approximately $321 per square foot. 4 Burnham Ave is a home located in Strafford County with nearby schools including Mast Way School, Oyster River Middle School, and Oyster River High School.
Ownership History
Date
Name
Owned For
Owner Type
Purchase Details
Closed on
Aug 18, 2009
Sold by
Knowles James H
Bought by
Garcia-Rasilla Carmen and Deleon Fernando Gonzal
Current Estimated Value
Home Financials for this Owner
Home Financials are based on the most recent Mortgage that was taken out on this home.
Original Mortgage
$258,400
Interest Rate
5.36%
Mortgage Type
Purchase Money Mortgage
Create a Home Valuation Report for This Property
The Home Valuation Report is an in-depth analysis detailing your home's value as well as a comparison with similar homes in the area
Home Values in the Area
Average Home Value in this Area
Purchase History
| Date | Buyer | Sale Price | Title Company |
|---|---|---|---|
| Garcia-Rasilla Carmen | $325,500 | -- |
Source: Public Records
Mortgage History
| Date | Status | Borrower | Loan Amount |
|---|---|---|---|
| Open | Garcia-Rasilla Carmen | $242,000 | |
| Closed | Garcia-Rasilla Carmen | $258,400 |
Source: Public Records
Tax History
| Year | Tax Paid | Tax Assessment Tax Assessment Total Assessment is a certain percentage of the fair market value that is determined by local assessors to be the total taxable value of land and additions on the property. | Land | Improvement |
|---|---|---|---|---|
| 2024 | $10,962 | $539,200 | $255,900 | $283,300 |
| 2023 | $11,043 | $539,200 | $255,900 | $283,300 |
| 2022 | $9,702 | $334,100 | $146,900 | $187,200 |
| 2021 | $9,311 | $333,600 | $146,400 | $187,200 |
| 2020 | $9,251 | $333,600 | $146,400 | $187,200 |
| 2019 | $9,151 | $333,600 | $146,400 | $187,200 |
| 2018 | $8,940 | $333,600 | $146,400 | $187,200 |
| 2017 | $8,307 | $271,100 | $94,400 | $176,700 |
| 2016 | $8,060 | $271,100 | $94,400 | $176,700 |
| 2015 | $8,092 | $271,100 | $94,400 | $176,700 |
| 2014 | $8,274 | $271,100 | $94,400 | $176,700 |
| 2013 | $8,244 | $271,100 | $94,400 | $176,700 |
Source: Public Records
Map
Nearby Homes
- 9 Young Dr
- 36 Woodman Rd
- 14 Young Dr
- 10 Young Dr
- 17 Foss Farm Rd
- 1014 Strafford Ave
- 275-279 Mast Rd
- 260-262 Mast Rd
- 1 Riverview Ct
- 140 Madbury Rd
- 0 Beech Hill Rd Unit 201-02-0-0-0,204-10-
- 320 Knox Marsh Rd
- 11 Willey Creek Rd
- 2 Toon Ln
- 5 River St
- 13 Spruce Dr
- 18 Beech St Unit B
- 2 Caverno Dr
- 6 Bay Rd Unit 35
- 88 Mast Rd
Your Personal Tour Guide
Ask me questions while you tour the home.