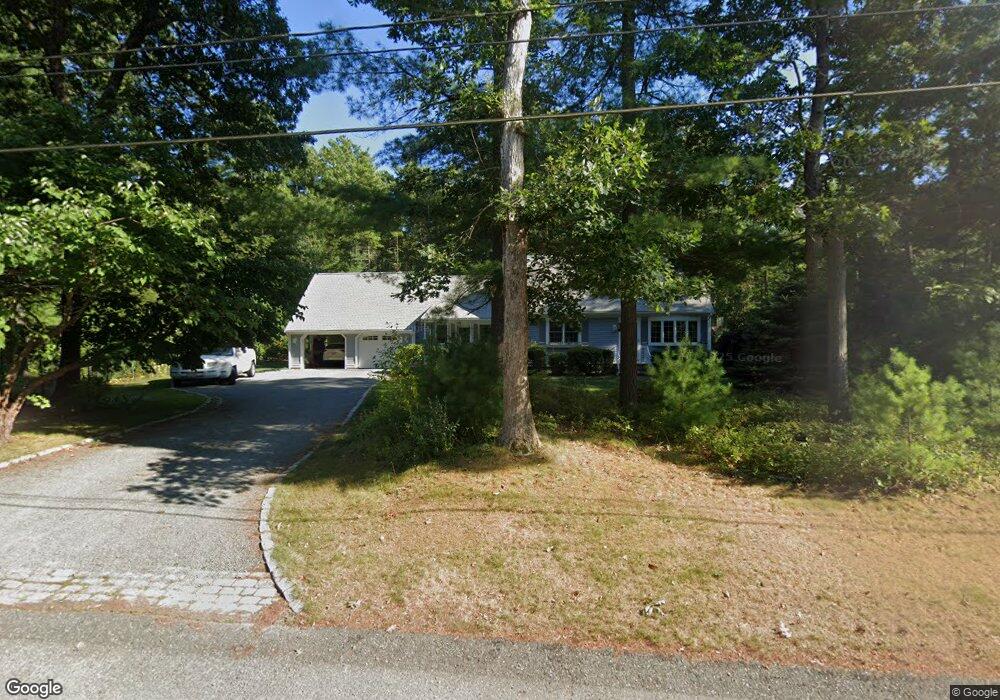
4 C h Clark Dr Assonet, MA 02702
Estimated Value: $592,000 - $664,000
3
Beds
3
Baths
2,216
Sq Ft
$280/Sq Ft
Est. Value
About This Home
This home is located at 4 C h Clark Dr, Assonet, MA 02702 and is currently estimated at $621,290, approximately $280 per square foot. 4 C h Clark Dr is a home located in Bristol County with nearby schools including Freetown Elementary School, George R Austin Intermediate School, and Freetown-Lakeville Middle School.
Ownership History
Date
Name
Owned For
Owner Type
Purchase Details
Closed on
Aug 12, 2011
Sold by
Clark Joseph P and Clark Ann M
Bought by
J & A Clark Ft
Current Estimated Value
Purchase Details
Closed on
Apr 4, 1979
Bought by
J & A Clark Ft
Create a Home Valuation Report for This Property
The Home Valuation Report is an in-depth analysis detailing your home's value as well as a comparison with similar homes in the area
Purchase History
| Date | Buyer | Sale Price | Title Company |
|---|---|---|---|
| J & A Clark Ft | -- | -- | |
| J & A Clark Ft | $47,900 | -- |
Source: Public Records
Mortgage History
| Date | Status | Borrower | Loan Amount |
|---|---|---|---|
| Previous Owner | J & A Clark Ft | $20,000 | |
| Previous Owner | J & A Clark Ft | $124,000 | |
| Previous Owner | J & A Clark Ft | $125,000 |
Source: Public Records
Tax History
| Year | Tax Paid | Tax Assessment Tax Assessment Total Assessment is a certain percentage of the fair market value that is determined by local assessors to be the total taxable value of land and additions on the property. | Land | Improvement |
|---|---|---|---|---|
| 2025 | $5,512 | $556,200 | $179,300 | $376,900 |
| 2024 | $5,476 | $525,000 | $169,100 | $355,900 |
| 2023 | $5,286 | $493,600 | $152,300 | $341,300 |
| 2022 | $5,037 | $417,700 | $129,000 | $288,700 |
| 2021 | $4,732 | $372,600 | $117,300 | $255,300 |
| 2020 | $4,691 | $360,300 | $112,800 | $247,500 |
| 2019 | $4,425 | $336,500 | $107,400 | $229,100 |
| 2018 | $4,195 | $315,200 | $107,400 | $207,800 |
| 2017 | $4,071 | $305,600 | $107,400 | $198,200 |
| 2016 | $3,843 | $293,600 | $104,300 | $189,300 |
| 2015 | $3,740 | $289,900 | $104,300 | $185,600 |
| 2014 | $3,584 | $284,200 | $102,200 | $182,000 |
Source: Public Records
Map
Nearby Homes
- 24 Bells Brook Rd
- 71 County St
- 145 County St
- 0 Sammys Ln
- 37 Simpson Ln
- 0 Chace Rd Unit 73481572
- 5 Hadley Heights Way
- 16 Water St Unit C
- 16 Water St Unit A
- 16 Water St Unit B
- 16 Water St Unit D
- 42 High St
- 1 Freetown St
- 92 Chace Rd
- 23 Elmwood Dr
- 00 Island Rd
- 73 Seymour St
- 0 Anthony St
- 14 Spruce Rd
- 23 5th Ave
Your Personal Tour Guide
Ask me questions while you tour the home.