Estimated Value: $489,329 - $619,000
1
Bed
1
Bath
750
Sq Ft
$746/Sq Ft
Est. Value
About This Home
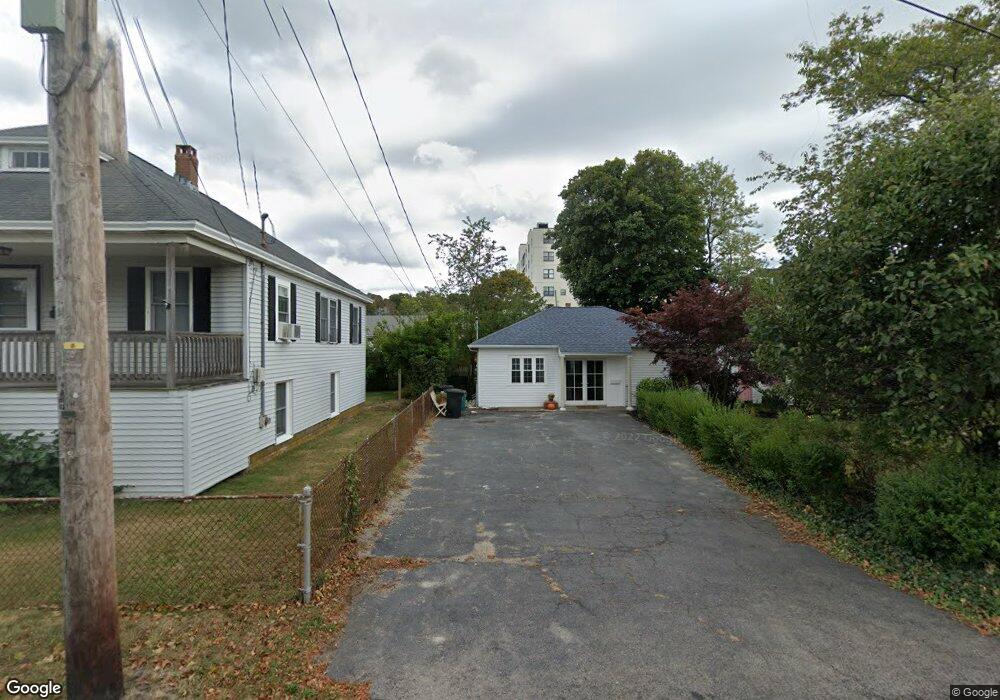
This home is located at 4 C St, Hull, MA 02045 and is currently estimated at $559,582, approximately $746 per square foot. 4 C St is a home located in Plymouth County with nearby schools including Lillian M. Jacobs Elementary School, Memorial Middle School, and Hull High School.
Ownership History
Date
Name
Owned For
Owner Type
Purchase Details
Closed on
Jun 13, 2024
Sold by
Contrado April R and Contrado Tammy L
Bought by
Todaro Rhonda H
Current Estimated Value
Home Financials for this Owner
Home Financials are based on the most recent Mortgage that was taken out on this home.
Original Mortgage
$484,903
Outstanding Balance
$477,692
Interest Rate
7.22%
Mortgage Type
Purchase Money Mortgage
Estimated Equity
$81,890
Purchase Details
Closed on
Sep 24, 2019
Sold by
Contrado April R and Contrado Dereck
Bought by
Contrado April R and Cantrado Tammy J
Home Financials for this Owner
Home Financials are based on the most recent Mortgage that was taken out on this home.
Original Mortgage
$237,500
Interest Rate
3.4%
Mortgage Type
New Conventional
Purchase Details
Closed on
Apr 29, 2019
Sold by
Lidington Mary B
Bought by
Contrado April R and Contrado Derek
Home Financials for this Owner
Home Financials are based on the most recent Mortgage that was taken out on this home.
Original Mortgage
$230,743
Interest Rate
4.2%
Mortgage Type
FHA
Purchase Details
Closed on
Jul 28, 2000
Sold by
Schevren John M and Scheuren Elaine M
Bought by
Kowalsky Mary E and Lidington John C
Purchase Details
Closed on
Apr 17, 1992
Sold by
Roussinos Constance E
Bought by
Scheuren John M and Scheuren Elaine M
Create a Home Valuation Report for This Property
The Home Valuation Report is an in-depth analysis detailing your home's value as well as a comparison with similar homes in the area
Home Values in the Area
Average Home Value in this Area
Purchase History
| Date | Buyer | Sale Price | Title Company |
|---|---|---|---|
| Todaro Rhonda H | $499,900 | None Available | |
| Contrado April R | -- | -- | |
| Contrado April R | $235,000 | -- | |
| Kowalsky Mary E | $121,000 | -- | |
| Scheuren John M | $85,000 | -- | |
| Kowalsky Mary E | $121,000 | -- | |
| Scheuren John M | $85,000 | -- |
Source: Public Records
Mortgage History
| Date | Status | Borrower | Loan Amount |
|---|---|---|---|
| Open | Todaro Rhonda H | $484,903 | |
| Previous Owner | Contrado April R | $237,500 | |
| Previous Owner | Contrado April R | $230,743 | |
| Previous Owner | Scheuren John M | $103,500 | |
| Previous Owner | Scheuren John M | $115,000 | |
| Previous Owner | Scheuren John M | $115,000 |
Source: Public Records
Tax History
| Year | Tax Paid | Tax Assessment Tax Assessment Total Assessment is a certain percentage of the fair market value that is determined by local assessors to be the total taxable value of land and additions on the property. | Land | Improvement |
|---|---|---|---|---|
| 2025 | $4,465 | $398,700 | $211,300 | $187,400 |
| 2024 | $3,679 | $315,800 | $201,500 | $114,300 |
| 2023 | $3,680 | $302,400 | $195,000 | $107,400 |
| 2022 | $3,556 | $283,600 | $182,000 | $101,600 |
| 2021 | $3,332 | $262,800 | $162,500 | $100,300 |
| 2020 | $3,270 | $255,100 | $169,000 | $86,100 |
| 2019 | $3,082 | $236,200 | $156,000 | $80,200 |
| 2018 | $3,034 | $226,100 | $156,000 | $70,100 |
| 2017 | $3,021 | $220,200 | $156,000 | $64,200 |
| 2016 | $2,793 | $207,200 | $143,000 | $64,200 |
| 2015 | $2,572 | $184,500 | $120,200 | $64,300 |
| 2014 | $2,366 | $170,600 | $110,500 | $60,100 |
Source: Public Records
Map
Nearby Homes
Your Personal Tour Guide
Ask me questions while you tour the home.