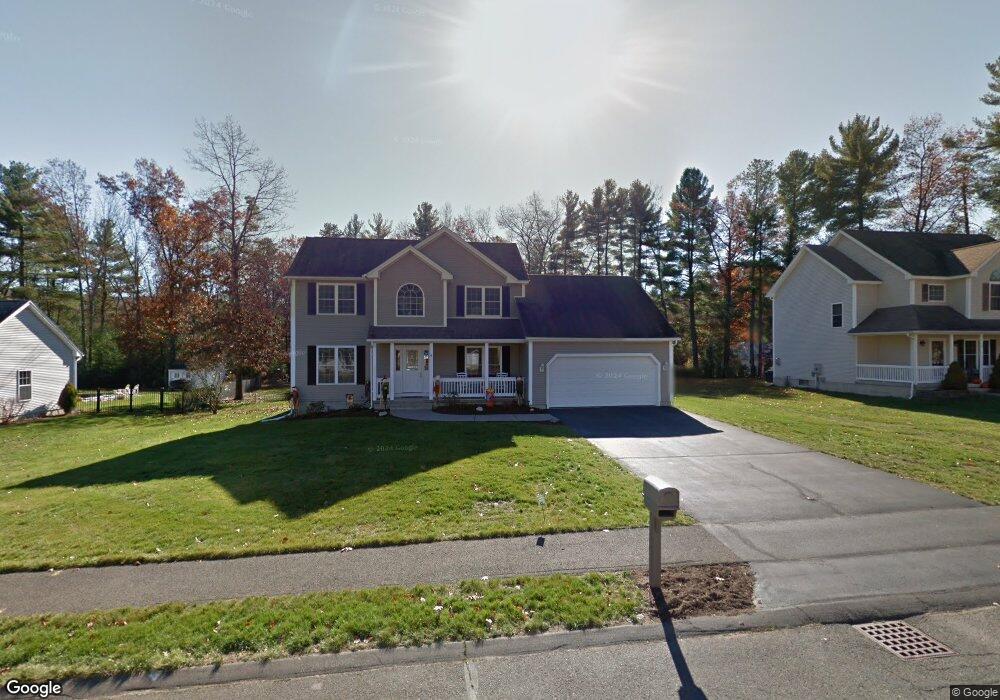
4 Camelot Ln Easthampton, MA 01027
Estimated Value: $506,000 - $651,000
3
Beds
3
Baths
1,732
Sq Ft
$325/Sq Ft
Est. Value
About This Home
This home is located at 4 Camelot Ln, Easthampton, MA 01027 and is currently estimated at $563,394, approximately $325 per square foot. 4 Camelot Ln is a home located in Hampshire County with nearby schools including Easthampton High School, Calvary Baptist Christian School, and Tri-County Schools.
Ownership History
Date
Name
Owned For
Owner Type
Purchase Details
Closed on
Oct 29, 2010
Sold by
Follansbee Nancy P
Bought by
Pouska Robert J and Grise Shelly J
Current Estimated Value
Home Financials for this Owner
Home Financials are based on the most recent Mortgage that was taken out on this home.
Original Mortgage
$218,000
Outstanding Balance
$144,710
Interest Rate
4.39%
Mortgage Type
Purchase Money Mortgage
Estimated Equity
$418,684
Create a Home Valuation Report for This Property
The Home Valuation Report is an in-depth analysis detailing your home's value as well as a comparison with similar homes in the area
Home Values in the Area
Average Home Value in this Area
Purchase History
| Date | Buyer | Sale Price | Title Company |
|---|---|---|---|
| Pouska Robert J | $305,000 | -- |
Source: Public Records
Mortgage History
| Date | Status | Borrower | Loan Amount |
|---|---|---|---|
| Open | Pouska Robert J | $218,000 |
Source: Public Records
Tax History
| Year | Tax Paid | Tax Assessment Tax Assessment Total Assessment is a certain percentage of the fair market value that is determined by local assessors to be the total taxable value of land and additions on the property. | Land | Improvement |
|---|---|---|---|---|
| 2025 | $6,440 | $471,100 | $121,800 | $349,300 |
| 2024 | $6,213 | $458,200 | $118,200 | $340,000 |
| 2023 | $4,733 | $323,100 | $93,600 | $229,500 |
| 2022 | $5,341 | $323,100 | $93,600 | $229,500 |
| 2021 | $6,133 | $334,600 | $93,600 | $241,000 |
| 2020 | $5,738 | $323,100 | $93,600 | $229,500 |
| 2019 | $4,924 | $318,500 | $93,600 | $224,900 |
| 2018 | $4,757 | $297,300 | $88,500 | $208,800 |
| 2017 | $4,647 | $286,700 | $84,900 | $201,800 |
| 2016 | $4,630 | $297,000 | $84,900 | $212,100 |
| 2015 | $4,500 | $297,000 | $84,900 | $212,100 |
Source: Public Records
Map
Nearby Homes
Your Personal Tour Guide
Ask me questions while you tour the home.