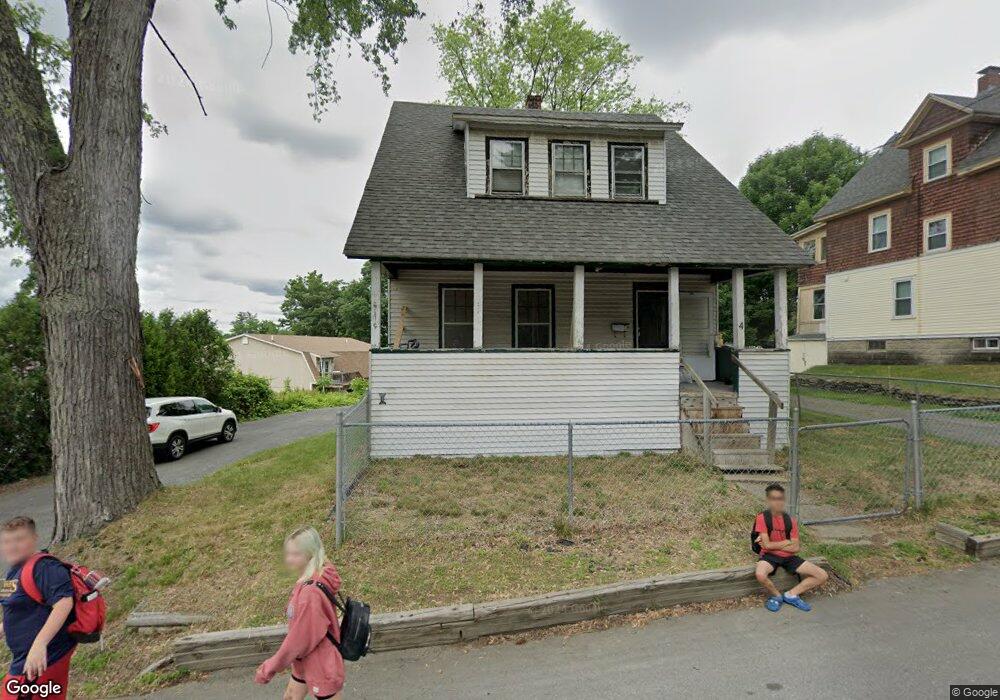
4 Charles St Claremont, NH 03743
South End NeighborhoodEstimated Value: $203,401 - $273,000
3
Beds
1
Bath
1,478
Sq Ft
$165/Sq Ft
Est. Value
About This Home
This home is located at 4 Charles St, Claremont, NH 03743 and is currently estimated at $244,600, approximately $165 per square foot. 4 Charles St is a home located in Sullivan County with nearby schools including Maple Avenue School, Claremont Middle School, and Stevens High School.
Ownership History
Date
Name
Owned For
Owner Type
Purchase Details
Closed on
Nov 17, 2023
Sold by
Makela Matthew and Royce Andrew L
Bought by
Stoddard Prop Hldg Llc
Current Estimated Value
Home Financials for this Owner
Home Financials are based on the most recent Mortgage that was taken out on this home.
Original Mortgage
$96,000
Outstanding Balance
$94,565
Interest Rate
7.49%
Mortgage Type
Purchase Money Mortgage
Estimated Equity
$150,035
Purchase Details
Closed on
Jul 21, 2011
Sold by
Kimel Suzanne
Bought by
Makela Matthew and Makela Barbara
Purchase Details
Closed on
Nov 20, 1997
Sold by
Ford Consumer Fin Co I
Bought by
Kimel Linda S and Kimel George F
Home Financials for this Owner
Home Financials are based on the most recent Mortgage that was taken out on this home.
Original Mortgage
$47,658
Interest Rate
7.17%
Mortgage Type
Purchase Money Mortgage
Create a Home Valuation Report for This Property
The Home Valuation Report is an in-depth analysis detailing your home's value as well as a comparison with similar homes in the area
Home Values in the Area
Average Home Value in this Area
Purchase History
| Date | Buyer | Sale Price | Title Company |
|---|---|---|---|
| Stoddard Prop Hldg Llc | $120,000 | None Available | |
| Makela Matthew | $49,900 | -- | |
| Kimel Linda S | $48,000 | -- |
Source: Public Records
Mortgage History
| Date | Status | Borrower | Loan Amount |
|---|---|---|---|
| Open | Stoddard Prop Hldg Llc | $96,000 | |
| Previous Owner | Kimel Linda S | $111,150 | |
| Previous Owner | Kimel Linda S | $112,500 | |
| Previous Owner | Kimel Linda S | $47,658 |
Source: Public Records
Tax History Compared to Growth
Tax History
| Year | Tax Paid | Tax Assessment Tax Assessment Total Assessment is a certain percentage of the fair market value that is determined by local assessors to be the total taxable value of land and additions on the property. | Land | Improvement |
|---|---|---|---|---|
| 2024 | $5,255 | $179,600 | $30,500 | $149,100 |
| 2023 | $4,993 | $179,600 | $30,500 | $149,100 |
| 2022 | $3,943 | $94,600 | $14,200 | $80,400 |
| 2021 | $3,877 | $94,600 | $14,200 | $80,400 |
| 2020 | $3,852 | $94,600 | $14,200 | $80,400 |
| 2019 | $3,809 | $94,600 | $14,200 | $80,400 |
| 2018 | $3,501 | $83,200 | $14,200 | $69,000 |
| 2017 | $3,549 | $83,200 | $14,200 | $69,000 |
| 2016 | $3,546 | $83,200 | $14,200 | $69,000 |
| 2015 | $3,450 | $83,200 | $14,200 | $69,000 |
| 2014 | $3,439 | $83,200 | $14,200 | $69,000 |
| 2013 | $3,980 | $109,800 | $14,600 | $95,200 |
Source: Public Records
Map
Nearby Homes
- 6 Charles St
- 52 W Pleasant St
- 239 Pleasant St
- 50 W Pleasant St
- 3 Charles St
- 249 Pleasant St
- 245 Pleasant St
- 255 Pleasant St
- 241 Pleasant St
- 44 W Pleasant St
- 8 Charles St
- 237 Pleasant St
- 269 Pleasant St
- 254 Pleasant St
- 260 Pleasant St
- 275 Pleasant St
- 233 Pleasant St
- 40 W Pleasant St
- 10 Charles St
- 193 Mulberry St