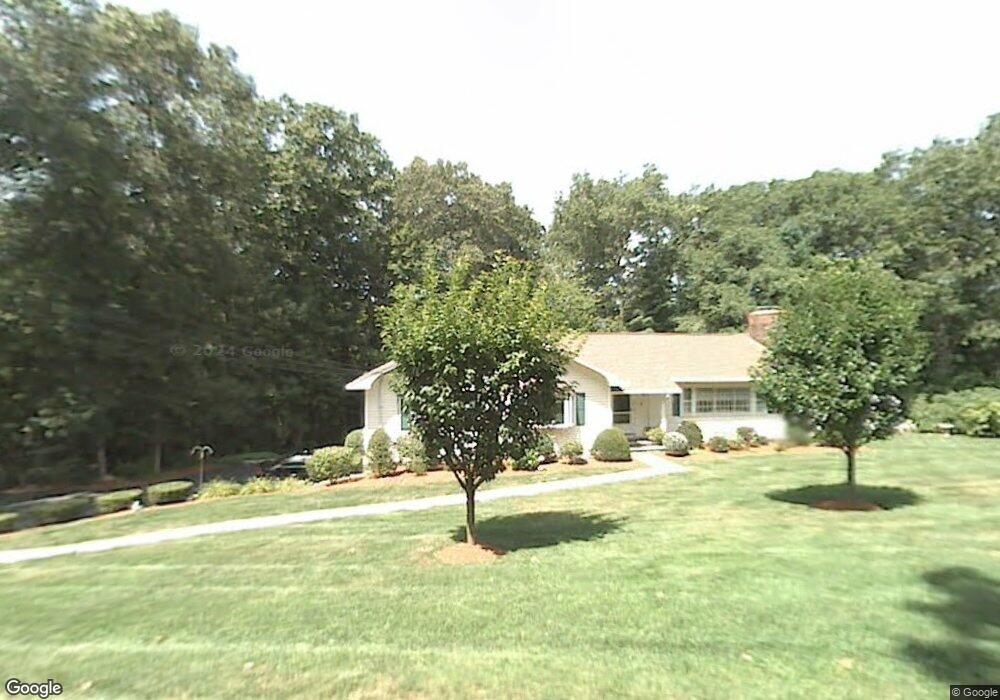
4 Checkerberry Ln Framingham, MA 01702
Estimated Value: $829,000 - $915,149
4
Beds
4
Baths
2,117
Sq Ft
$412/Sq Ft
Est. Value
About This Home
This home is located at 4 Checkerberry Ln, Framingham, MA 01702 and is currently estimated at $873,037, approximately $412 per square foot. 4 Checkerberry Ln is a home located in Middlesex County with nearby schools including Framingham High School, Pincushion Hill Montessori School, and Summit Montessori School.
Ownership History
Date
Name
Owned For
Owner Type
Purchase Details
Closed on
Aug 30, 2019
Sold by
Huff Daniel W and Huff Meredith P
Bought by
Roane David H and Sehgal Priya
Current Estimated Value
Home Financials for this Owner
Home Financials are based on the most recent Mortgage that was taken out on this home.
Original Mortgage
$488,000
Outstanding Balance
$427,450
Interest Rate
3.6%
Mortgage Type
New Conventional
Estimated Equity
$445,587
Purchase Details
Closed on
Nov 29, 2010
Sold by
Prhc Rt and Covell
Bought by
Huff Daniel W and Huff Meredith P
Home Financials for this Owner
Home Financials are based on the most recent Mortgage that was taken out on this home.
Original Mortgage
$399,638
Interest Rate
4.25%
Mortgage Type
Purchase Money Mortgage
Purchase Details
Closed on
Oct 16, 1997
Sold by
Helen K Fitts Ret and Fitts
Bought by
Prhc Rt and Covell
Create a Home Valuation Report for This Property
The Home Valuation Report is an in-depth analysis detailing your home's value as well as a comparison with similar homes in the area
Home Values in the Area
Average Home Value in this Area
Purchase History
| Date | Buyer | Sale Price | Title Company |
|---|---|---|---|
| Roane David H | $610,000 | -- | |
| Roane David H | $610,000 | -- | |
| Huff Daniel W | $439,900 | -- | |
| Huff Daniel W | $439,900 | -- | |
| Prhc Rt | $259,900 | -- |
Source: Public Records
Mortgage History
| Date | Status | Borrower | Loan Amount |
|---|---|---|---|
| Open | Roane David H | $488,000 | |
| Closed | Roane David H | $488,000 | |
| Previous Owner | Huff Daniel W | $399,638 | |
| Previous Owner | Prhc Rt | $175,000 |
Source: Public Records
Tax History Compared to Growth
Tax History
| Year | Tax Paid | Tax Assessment Tax Assessment Total Assessment is a certain percentage of the fair market value that is determined by local assessors to be the total taxable value of land and additions on the property. | Land | Improvement |
|---|---|---|---|---|
| 2025 | $10,588 | $886,800 | $308,900 | $577,900 |
| 2024 | $9,857 | $791,100 | $275,100 | $516,000 |
| 2023 | $9,095 | $694,800 | $245,500 | $449,300 |
| 2022 | $8,935 | $650,300 | $223,100 | $427,200 |
| 2021 | $8,732 | $621,500 | $214,500 | $407,000 |
| 2020 | $9,202 | $614,300 | $195,200 | $419,100 |
| 2019 | $8,951 | $582,000 | $197,900 | $384,100 |
| 2018 | $8,761 | $536,800 | $193,900 | $342,900 |
| 2017 | $8,510 | $509,300 | $188,300 | $321,000 |
| 2016 | $8,520 | $490,200 | $190,000 | $300,200 |
| 2015 | $8,326 | $467,200 | $189,900 | $277,300 |
Source: Public Records
Map
Nearby Homes
- 327 Singletary Ln
- 273 Singletary Ln
- 27 Travis Dr
- 34 Jodie Rd
- 29 Jodie Rd
- 40 Eden Rd
- 53 Long Ave
- 212 Fountain St Unit A,212
- 212 Fountain St
- 12 & 14 Waverly St
- 7 Albert Ray Dr
- 54 Vose St
- 37 Wilson Ave
- 15 Bellmore Rd
- 8 Bellmore Rd
- 53 Wilson Ave
- 848 Waverly St
- 818 Waverly St
- 6 B Harmony Ln Unit 2
- 26 Wilde Ave
- 22 Checkerberry Ln
- 6 Checkerberry Ln
- 26 Checkerberry Ln
- 20 Hodder Ln
- 7 Checkerberry Ln
- 9 Checkerberry Ln
- 5 Checkerberry Ln
- 28 Checkerberry Ln
- 19 Hodder Ln
- 16 Hodder Ln Unit R
- 16 Hodder Ln
- 16r Hodder Ln
- 21 Hodder Ln
- 3 Checkerberry Ln
- 17 Hodder Ln
- 11 Checkerberry Ln
- 26 Hodder Ln
- 14 Hodder Ln Unit R
- 14 Hodder Ln
- 14R Hodder Ln