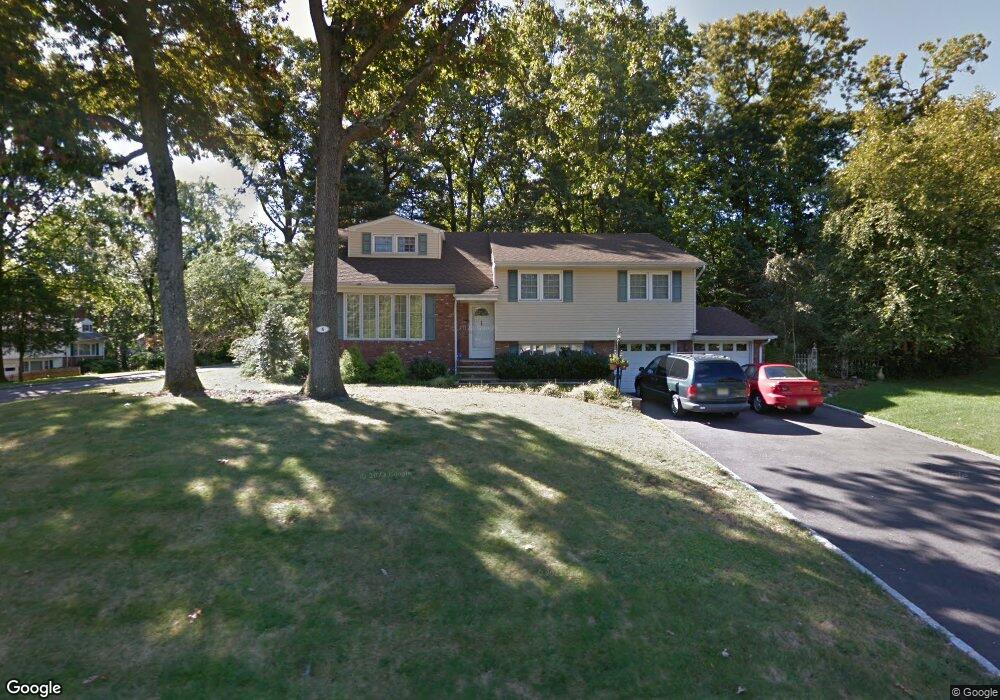
4 Chestnut St New Providence, NJ 07974
Estimated Value: $929,469 - $1,764,000
Studio
--
Bath
2,851
Sq Ft
$423/Sq Ft
Est. Value
About This Home
This home is located at 4 Chestnut St, New Providence, NJ 07974 and is currently estimated at $1,204,867, approximately $422 per square foot. 4 Chestnut St is a home located in Union County with nearby schools including New Providence High School, The Academy of Our Lady of Peace, and Oak Knoll School of the Holy Child.
Ownership History
Date
Name
Owned For
Owner Type
Purchase Details
Closed on
Mar 16, 2013
Sold by
Morrison Edmond Ellen
Bought by
Song Xi and Li Yanbing
Current Estimated Value
Home Financials for this Owner
Home Financials are based on the most recent Mortgage that was taken out on this home.
Original Mortgage
$100,000
Outstanding Balance
$70,937
Interest Rate
3.58%
Mortgage Type
Credit Line Revolving
Estimated Equity
$1,133,930
Purchase Details
Closed on
Jan 17, 2013
Sold by
Morrison Marie L
Bought by
Morrison Edmond Allen
Home Financials for this Owner
Home Financials are based on the most recent Mortgage that was taken out on this home.
Original Mortgage
$370,000
Outstanding Balance
$261,572
Interest Rate
3.58%
Mortgage Type
New Conventional
Estimated Equity
$943,295
Purchase Details
Closed on
Dec 13, 1982
Sold by
Morrison Edmond A
Bought by
Morrison Marie L
Create a Home Valuation Report for This Property
The Home Valuation Report is an in-depth analysis detailing your home's value as well as a comparison with similar homes in the area
Home Values in the Area
Average Home Value in this Area
Purchase History
| Date | Buyer | Sale Price | Title Company |
|---|---|---|---|
| Song Xi | $640,000 | Old Republic National Title | |
| Morrison Edmond Allen | -- | -- | |
| Morrison Marie L | -- | None Available |
Source: Public Records
Mortgage History
| Date | Status | Borrower | Loan Amount |
|---|---|---|---|
| Open | Song Xi | $100,000 | |
| Open | Song Xi | $370,000 |
Source: Public Records
Tax History
| Year | Tax Paid | Tax Assessment Tax Assessment Total Assessment is a certain percentage of the fair market value that is determined by local assessors to be the total taxable value of land and additions on the property. | Land | Improvement |
|---|---|---|---|---|
| 2025 | $17,711 | $343,100 | $141,700 | $201,400 |
| 2024 | $17,179 | $343,100 | $141,700 | $201,400 |
| 2023 | $17,179 | $343,100 | $141,700 | $201,400 |
| 2022 | $16,942 | $343,100 | $141,700 | $201,400 |
| 2021 | $16,819 | $343,100 | $141,700 | $201,400 |
| 2020 | $16,812 | $343,100 | $141,700 | $201,400 |
| 2019 | $16,709 | $343,100 | $141,700 | $201,400 |
| 2018 | $16,623 | $343,100 | $141,700 | $201,400 |
| 2017 | $16,352 | $343,100 | $141,700 | $201,400 |
| 2016 | $16,122 | $343,100 | $141,700 | $201,400 |
| 2015 | $15,899 | $343,100 | $141,700 | $201,400 |
| 2014 | $15,659 | $343,100 | $141,700 | $201,400 |
Source: Public Records
Map
Nearby Homes
- 157 Grant Ave
- 34 Grant Ave
- 16 Little Wolf Rd
- 32 Marion Ave
- 17 Badgley Dr
- 110 Livingston Ave
- 50 Livingston Ave
- 33 Yarmouth Dr
- 20 Pittsford Way
- 32 Charnwood Rd
- 709 Springfield Ave Unit One
- 709 Springfield Ave Unit 4
- 709 Springfield Ave Unit 2
- 709 Springfield Ave Unit 3
- 16 Terrace Rd
- 36 Terrace Rd
- 100 Commonwealth Ave
- 4 Tip Top Way
- 359 Dogwood Way
- 471 River Rd
Your Personal Tour Guide
Ask me questions while you tour the home.