Estimated Value: $1,303,836 - $1,508,000
3
Beds
3
Baths
3,245
Sq Ft
$443/Sq Ft
Est. Value
About This Home
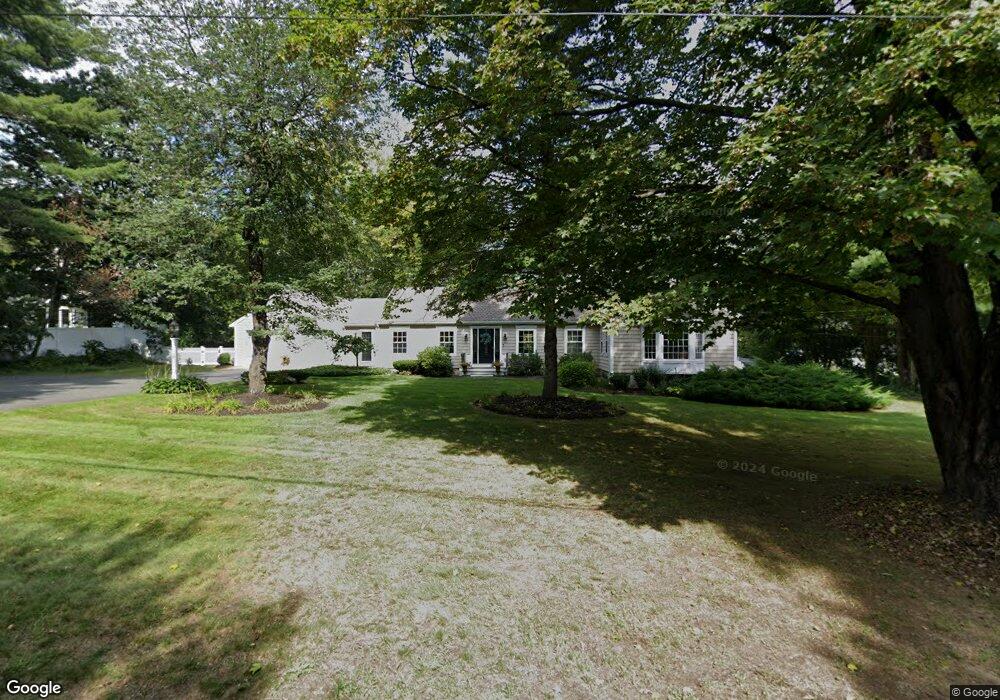
This home is located at 4 Cranberry Ln, Dover, MA 02030 and is currently estimated at $1,436,459, approximately $442 per square foot. 4 Cranberry Ln is a home located in Norfolk County with nearby schools including Chickering Elementary School, Dover-Sherborn Regional Middle School, and Dover-Sherborn Regional High School.
Ownership History
Date
Name
Owned For
Owner Type
Purchase Details
Closed on
Sep 17, 2025
Sold by
Daniele Paul and Daniele Paola
Bought by
Paola Daniele Lt and Daniele
Current Estimated Value
Purchase Details
Closed on
Aug 30, 2021
Sold by
Connolly James M and Connolly Joanne G
Bought by
Daniele Paul and Daniele Paola
Purchase Details
Closed on
Feb 14, 2018
Sold by
Connolly Joanne G
Bought by
Connolly James M and Connolly Joanne G
Purchase Details
Closed on
Nov 8, 2013
Sold by
Connolly James M and Connolly Joanne G
Bought by
Connolly Joanne G
Purchase Details
Closed on
Jun 9, 1976
Bought by
Connolly Joanne G
Create a Home Valuation Report for This Property
The Home Valuation Report is an in-depth analysis detailing your home's value as well as a comparison with similar homes in the area
Home Values in the Area
Average Home Value in this Area
Purchase History
| Date | Buyer | Sale Price | Title Company |
|---|---|---|---|
| Paola Daniele Lt | -- | -- | |
| Daniele Paul | $1,152,000 | None Available | |
| Connolly James M | -- | -- | |
| Connolly Joanne G | -- | -- | |
| Connolly Joanne G | -- | -- | |
| Connolly Joanne G | $62,000 | -- |
Source: Public Records
Mortgage History
| Date | Status | Borrower | Loan Amount |
|---|---|---|---|
| Previous Owner | Connolly Joanne G | $243,750 | |
| Previous Owner | Connolly Joanne G | $200,000 |
Source: Public Records
Tax History
| Year | Tax Paid | Tax Assessment Tax Assessment Total Assessment is a certain percentage of the fair market value that is determined by local assessors to be the total taxable value of land and additions on the property. | Land | Improvement |
|---|---|---|---|---|
| 2025 | $12,923 | $1,146,700 | $643,500 | $503,200 |
| 2024 | $11,557 | $1,054,500 | $621,700 | $432,800 |
| 2023 | $11,411 | $936,100 | $545,500 | $390,600 |
| 2022 | $10,623 | $855,300 | $523,700 | $331,600 |
| 2021 | $10,757 | $834,500 | $523,700 | $310,800 |
| 2020 | $10,715 | $834,500 | $523,700 | $310,800 |
| 2019 | $10,790 | $834,500 | $523,700 | $310,800 |
| 2018 | $10,467 | $815,200 | $523,700 | $291,500 |
| 2017 | $10,522 | $806,300 | $480,200 | $326,100 |
| 2016 | $10,091 | $783,500 | $480,200 | $303,300 |
| 2015 | $9,745 | $767,300 | $456,200 | $311,100 |
Source: Public Records
Map
Nearby Homes
Your Personal Tour Guide
Ask me questions while you tour the home.