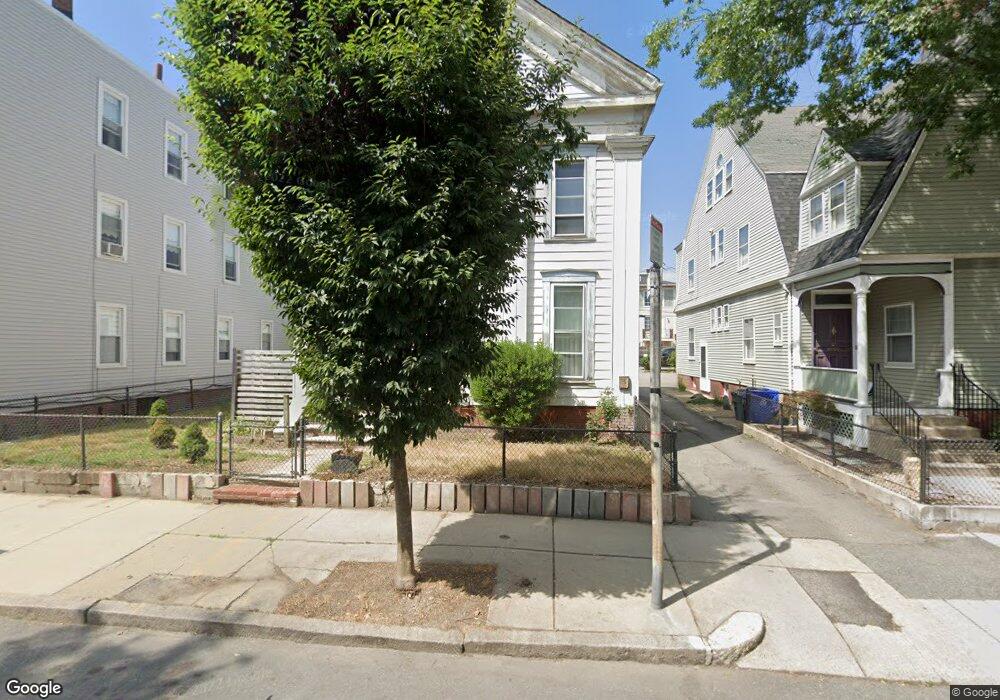
4 Dean Way Boston, MA 02127
South Boston NeighborhoodEstimated Value: $937,510 - $1,301,000
About This Home
Great location on South Boston's sought after East Side. Near beaches, parks, Castle Island, and more! Easy access to MBTA bus routes to the Red Line at Broadway and the 7, 9, 11 buses that take you to Copley Square by going through Downtown - great commuting location! Close to shopping, dining, and nightlife on West & East Broadway! Also convenient to Seaport District, City Point, K, L, & M Street Beaches, Joe Moakley Park with tennis courts, baseball field, and basketball courts, Thomas Park, Dry Docks, Boston Convention Center, Design Center, and much more! Many of these large attractions are intermixed with small local shops, some of which have been operating for years! A great area with a small community feel that is just a quick ride to Downtown Boston!
Ownership History
Purchase Details
Home Values in the Area
Average Home Value in this Area
Purchase History
| Date | Buyer | Sale Price | Title Company |
|---|---|---|---|
| Dean Way Series | $155,000 | -- |
Property History
| Date | Event | Price | List to Sale | Price per Sq Ft |
|---|---|---|---|---|
| 02/10/2025 02/10/25 | Off Market | $3,600 | -- | -- |
| 01/11/2025 01/11/25 | For Rent | -- | -- | -- |
| 10/08/2024 10/08/24 | Off Market | $3,600 | -- | -- |
| 10/25/2022 10/25/22 | For Rent | $3,600 | -- | -- |
Tax History Compared to Growth
Tax History
| Year | Tax Paid | Tax Assessment Tax Assessment Total Assessment is a certain percentage of the fair market value that is determined by local assessors to be the total taxable value of land and additions on the property. | Land | Improvement |
|---|---|---|---|---|
| 2025 | $11,625 | $1,003,900 | $414,200 | $589,700 |
| 2024 | $10,357 | $950,200 | $359,900 | $590,300 |
| 2023 | $9,631 | $896,700 | $339,600 | $557,100 |
| 2022 | $8,948 | $822,400 | $311,500 | $510,900 |
| 2021 | $8,403 | $787,500 | $302,400 | $485,100 |
| 2020 | $7,323 | $693,500 | $295,100 | $398,400 |
| 2019 | $6,703 | $636,000 | $224,100 | $411,900 |
| 2018 | $6,350 | $605,900 | $224,100 | $381,800 |
| 2017 | $6,108 | $576,800 | $224,100 | $352,700 |
| 2016 | $5,517 | $501,500 | $224,100 | $277,400 |
| 2015 | $6,642 | $548,500 | $197,300 | $351,200 |
| 2014 | $6,040 | $480,100 | $197,300 | $282,800 |
Map
- 945 E Broadway Unit 7
- 933 E Broadway
- 915 E 4th St
- 907 E 4th St Unit 2
- 901 E Broadway Unit 1
- 37 Farragut Rd Unit 7
- 37 Farragut Rd Unit 6
- 37 Farragut Rd Unit Four
- 37 Farragut Rd Unit 3
- 37 Farragut Rd Unit 5
- 37 Farragut Rd Unit 2
- 33 Lennon Ct Unit 39
- 803 E 5th St Unit 1
- 765 E 3rd St Unit 201
- 823 E 6th St Unit 5
- 52 O St Unit 3
- 7 Kemble Place
- 786 E 6th St Unit 788
- 733 E 3rd St
- 838 E Broadway Unit 7
- 4 Dean Way
- 4 Dean Way Unit SF
- 4 Dean Way Unit 4
- 4 Dean Way Unit NA
- 4 Dean Way Unit 1
- 4 Dean Way Unit SFR
- 924 E 4th St
- 920 E 4th St
- 920 E 4th St Unit 1
- 920 E 4th St Unit 2
- 920 E 4th St
- 922 E 4th St
- 922 E 4th St Unit 1
- 918 E 4th St Unit 920
- 947 E Broadway Unit 9
- 947 E Broadway
- 947 E Broadway Unit 4
- 945 E Broadway
- 945 E Broadway Unit 9
- 945 E Broadway Unit 8