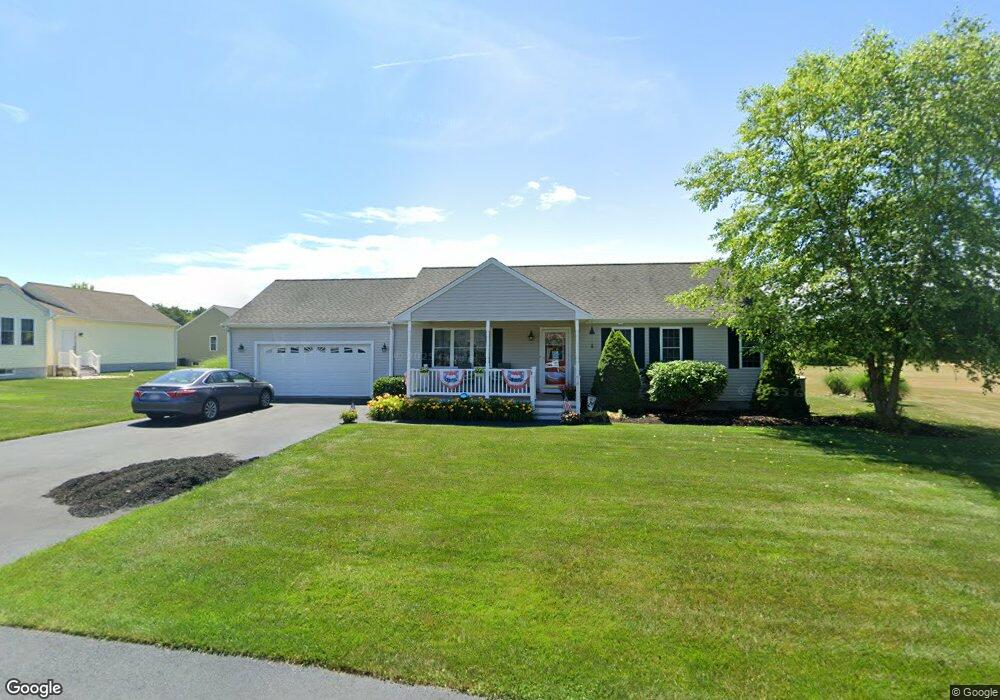
4 Della Way East Bridgewater, MA 02333
Estimated Value: $565,172 - $630,000
2
Beds
2
Baths
1,488
Sq Ft
$395/Sq Ft
Est. Value
About This Home
This home is located at 4 Della Way, East Bridgewater, MA 02333 and is currently estimated at $588,293, approximately $395 per square foot. 4 Della Way is a home located in Plymouth County with nearby schools including Central Elementary School, Gordon W Mitchell Middle School, and East Bridgewater Jr./Sr. High School.
Ownership History
Date
Name
Owned For
Owner Type
Purchase Details
Closed on
Jul 5, 2017
Sold by
Sarcia Thomas J and Sarcia Mildred T
Bought by
Sarcia Michael W and Sarcia Steven A
Current Estimated Value
Purchase Details
Closed on
Sep 2, 2011
Sold by
Finn William R
Bought by
Sarcia Thomas J and Sarcia Mildred T
Home Financials for this Owner
Home Financials are based on the most recent Mortgage that was taken out on this home.
Original Mortgage
$175,000
Interest Rate
4.52%
Mortgage Type
Purchase Money Mortgage
Purchase Details
Closed on
Sep 27, 2005
Sold by
White Pines Village In
Bought by
Finn Willian R
Home Financials for this Owner
Home Financials are based on the most recent Mortgage that was taken out on this home.
Original Mortgage
$229,300
Interest Rate
5.92%
Mortgage Type
Purchase Money Mortgage
Create a Home Valuation Report for This Property
The Home Valuation Report is an in-depth analysis detailing your home's value as well as a comparison with similar homes in the area
Home Values in the Area
Average Home Value in this Area
Purchase History
| Date | Buyer | Sale Price | Title Company |
|---|---|---|---|
| Sarcia Michael W | -- | -- | |
| Sarcia Thomas J | $275,000 | -- | |
| Finn Willian R | $311,000 | -- |
Source: Public Records
Mortgage History
| Date | Status | Borrower | Loan Amount |
|---|---|---|---|
| Previous Owner | Sarcia Thomas J | $175,000 | |
| Previous Owner | Finn Willian R | $229,300 |
Source: Public Records
Tax History Compared to Growth
Tax History
| Year | Tax Paid | Tax Assessment Tax Assessment Total Assessment is a certain percentage of the fair market value that is determined by local assessors to be the total taxable value of land and additions on the property. | Land | Improvement |
|---|---|---|---|---|
| 2025 | $6,750 | $493,800 | $124,200 | $369,600 |
| 2024 | $6,635 | $479,400 | $119,400 | $360,000 |
| 2023 | $6,466 | $447,500 | $119,400 | $328,100 |
| 2022 | $6,462 | $414,200 | $108,600 | $305,600 |
| 2021 | $6,187 | $362,900 | $104,400 | $258,500 |
| 2020 | $6,086 | $352,000 | $100,400 | $251,600 |
| 2019 | $5,832 | $332,100 | $89,500 | $242,600 |
| 2018 | $5,519 | $307,300 | $89,500 | $217,800 |
| 2017 | $5,404 | $295,300 | $85,400 | $209,900 |
| 2016 | $5,210 | $286,900 | $85,400 | $201,500 |
| 2015 | $5,053 | $284,500 | $84,800 | $199,700 |
| 2014 | $4,884 | $281,200 | $83,000 | $198,200 |
Source: Public Records
Map
Nearby Homes
- 5 Della Way
- 9 Daisy Ln
- 844 Washington St
- 1247 Central St
- 936 Central St
- 1 Simmons Place
- 14 Mountain Ash Rd
- 9 Hemlock Dr
- 572 Harvard St
- 217 Crystal Water Dr
- 182 Crystal Water Dr Unit 182
- 78 Crystal Water Dr
- 28 Brookbend Way E
- 84 Washington St
- 70 Surrey Ln
- 70 Surrey Ln
- 611 N Bedford St
- 585 N Bedford St
- 11 Harmony Crossing
- 521 Franklin St