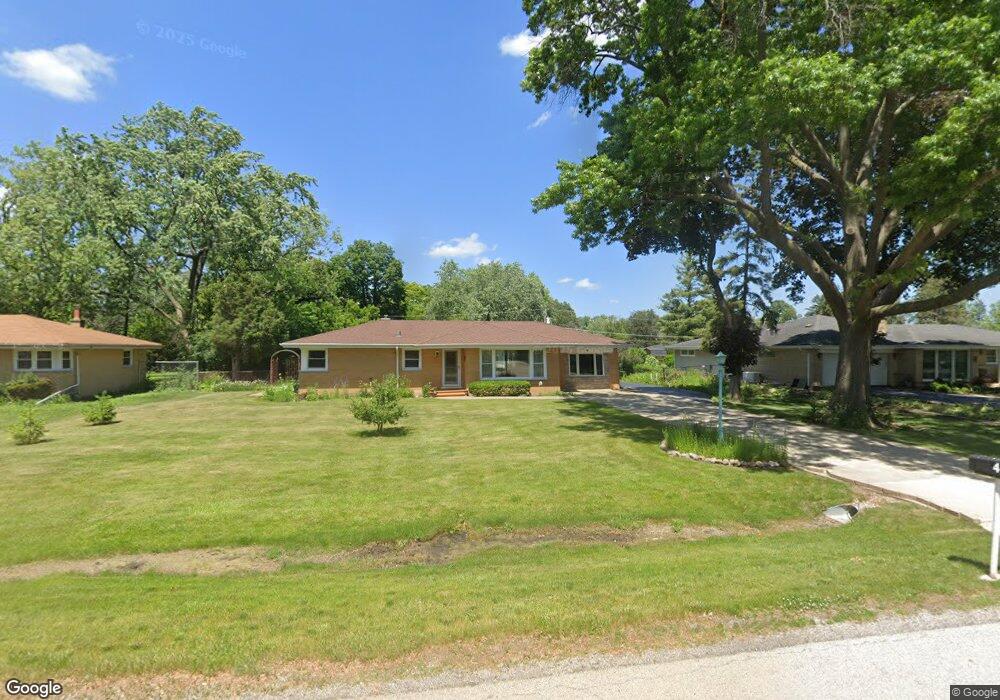
4 Drake Terrace Prospect Heights, IL 60070
Estimated Value: $398,945 - $438,000
2
Beds
1
Bath
1,458
Sq Ft
$289/Sq Ft
Est. Value
About This Home
This home is located at 4 Drake Terrace, Prospect Heights, IL 60070 and is currently estimated at $420,736, approximately $288 per square foot. 4 Drake Terrace is a home located in Cook County with nearby schools including Dwight D Eisenhower Elementary School, Anne Sullivan Elementary School, and Betsy Ross Elementary School.
Ownership History
Date
Name
Owned For
Owner Type
Purchase Details
Closed on
Jul 11, 2002
Sold by
Fardoux Andre and Fardoux Mary Jo
Bought by
Sylvia Michael G and Sylvia Patricia J
Current Estimated Value
Home Financials for this Owner
Home Financials are based on the most recent Mortgage that was taken out on this home.
Original Mortgage
$160,000
Outstanding Balance
$68,212
Interest Rate
6.79%
Estimated Equity
$352,524
Purchase Details
Closed on
Nov 1, 2000
Sold by
Fardoux Andre
Bought by
Fardoux Andre and Fardoux Mary Jo
Home Financials for this Owner
Home Financials are based on the most recent Mortgage that was taken out on this home.
Original Mortgage
$115,000
Interest Rate
7.91%
Purchase Details
Closed on
Oct 27, 2000
Sold by
Lasalle Bank National Assn
Bought by
Fardoux Andre
Home Financials for this Owner
Home Financials are based on the most recent Mortgage that was taken out on this home.
Original Mortgage
$115,000
Interest Rate
7.91%
Create a Home Valuation Report for This Property
The Home Valuation Report is an in-depth analysis detailing your home's value as well as a comparison with similar homes in the area
Home Values in the Area
Average Home Value in this Area
Purchase History
| Date | Buyer | Sale Price | Title Company |
|---|---|---|---|
| Sylvia Michael G | $255,000 | -- | |
| Fardoux Andre | -- | -- | |
| Fardoux Andre | $225,000 | -- |
Source: Public Records
Mortgage History
| Date | Status | Borrower | Loan Amount |
|---|---|---|---|
| Open | Sylvia Michael G | $160,000 | |
| Previous Owner | Fardoux Andre | $115,000 |
Source: Public Records
Tax History Compared to Growth
Tax History
| Year | Tax Paid | Tax Assessment Tax Assessment Total Assessment is a certain percentage of the fair market value that is determined by local assessors to be the total taxable value of land and additions on the property. | Land | Improvement |
|---|---|---|---|---|
| 2024 | -- | $31,003 | $15,503 | $15,500 |
| 2023 | -- | $31,003 | $15,503 | $15,500 |
| 2022 | $0 | $31,003 | $15,503 | $15,500 |
| 2021 | $7,634 | $27,687 | $12,534 | $15,153 |
| 2020 | $7,634 | $27,687 | $12,534 | $15,153 |
| 2019 | $0 | $30,798 | $12,534 | $18,264 |
| 2018 | $0 | $29,025 | $11,030 | $17,995 |
| 2017 | $0 | $29,025 | $11,030 | $17,995 |
| 2016 | $4,199 | $29,025 | $11,030 | $17,995 |
| 2015 | $7,634 | $26,220 | $9,526 | $16,694 |
| 2014 | $7,560 | $26,220 | $9,526 | $16,694 |
| 2013 | $7,356 | $26,220 | $9,526 | $16,694 |
Source: Public Records
Map
Nearby Homes
- 1014 N Elmhurst Rd
- 10 N Wildwood Dr
- 21 E Stonegate Dr
- 1201 Pleasant Run Dr Unit 312
- 940 Tanglewood Dr
- 1094 Shady Tree Ln
- 1088 Pear Tree Ln
- 701 Garth Rd
- 1376 Longacre Ln Unit 113
- 1321 Longacre Ln Unit 45
- 1430 Sandstone Dr Unit 202
- 1500 Sandstone Dr Unit 307
- 1450 Sandpebble Dr Unit 333
- 1450 Sandpebble Dr Unit 227
- 1425 Sandpebble Dr Unit 227
- 1425 Sandpebble Dr Unit 340
- 1525 Sander Ct Unit 103
- 1550 Sandpebble Dr Unit 209
- 200 Violet Ln
- 412 Cherry Creek Ln
- 2 Drake Terrace
- 3 Prospect Dr
- 8 Drake Terrace
- 5 Prospect Dr
- 1 Prospect Dr
- 3 Drake Terrace
- 1 Drake Terrace
- 5 Drake Terrace
- 7 Prospect Dr
- 10 Drake Terrace
- 7 Drake Terrace
- 30 E Stonegate Dr
- 9 Prospect Dr
- 1016 N Elmhurst Rd
- 35 E Stonegate Dr
- 12 Drake Terrace
- 1100 N Maple Ln
- 9 Drake Terrace
- 2 Prospect Dr
- 11 Prospect Dr