4 Elm St Bridgeport, OH 43912
Estimated Value: $115,616 - $182,000
3
Beds
2
Baths
1,652
Sq Ft
$89/Sq Ft
Est. Value
About This Home
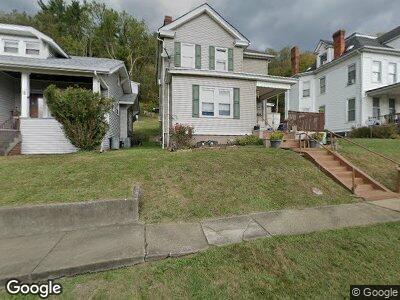
This home is located at 4 Elm St, Bridgeport, OH 43912 and is currently estimated at $146,904, approximately $88 per square foot. 4 Elm St is a home located in Belmont County with nearby schools including Bridgeport Elementary School, Bridgeport Middle School, and Bridgeport High School.
Ownership History
Date
Name
Owned For
Owner Type
Purchase Details
Closed on
Dec 12, 2011
Sold by
Foston Pearl M
Bought by
Foston Orlando A
Current Estimated Value
Purchase Details
Closed on
Apr 4, 2003
Sold by
Foston Pearl M
Bought by
Foston Pearl M
Purchase Details
Closed on
Jan 9, 2002
Sold by
Callarik John
Bought by
Callarik John
Purchase Details
Closed on
Sep 10, 2001
Sold by
Gulker Ronald D
Bought by
Gulker Ronald D
Purchase Details
Closed on
Sep 4, 2001
Sold by
Moore Dorothy J
Bought by
Moore Dorothy J
Purchase Details
Closed on
Jan 1, 1986
Sold by
Moore Walter A and Moore Dorothy
Bought by
Moore Walter A and Moore Dorothy
Create a Home Valuation Report for This Property
The Home Valuation Report is an in-depth analysis detailing your home's value as well as a comparison with similar homes in the area
Home Values in the Area
Average Home Value in this Area
Purchase History
| Date | Buyer | Sale Price | Title Company |
|---|---|---|---|
| Foston Orlando A | -- | Attorney | |
| Foston Pearl M | $72,000 | -- | |
| Callarik John | $8,000 | -- | |
| Gulker Ronald D | $8,000 | -- | |
| Moore Dorothy J | -- | -- | |
| Moore Walter A | -- | -- |
Source: Public Records
Tax History Compared to Growth
Tax History
| Year | Tax Paid | Tax Assessment Tax Assessment Total Assessment is a certain percentage of the fair market value that is determined by local assessors to be the total taxable value of land and additions on the property. | Land | Improvement |
|---|---|---|---|---|
| 2024 | $1,455 | $38,430 | $3,090 | $35,340 |
| 2023 | $1,280 | $30,530 | $3,090 | $27,440 |
| 2022 | $1,279 | $30,534 | $3,090 | $27,444 |
| 2021 | $1,298 | $30,534 | $3,090 | $27,444 |
| 2020 | $1,126 | $26,550 | $2,690 | $23,860 |
| 2019 | $1,128 | $26,550 | $2,690 | $23,860 |
| 2018 | $1,154 | $26,550 | $2,690 | $23,860 |
| 2017 | $1,291 | $27,570 | $2,390 | $25,180 |
| 2016 | $1,267 | $27,570 | $2,390 | $25,180 |
| 2015 | $1,262 | $27,570 | $2,390 | $25,180 |
| 2014 | $1,285 | $27,350 | $2,170 | $25,180 |
| 2013 | $1,194 | $27,350 | $2,170 | $25,180 |
Source: Public Records
Map
Nearby Homes
- 1116 Howard St
- 56559 Boyd Ave
- 810 Howard St
- 516 Bennett St
- 508 W Bennett
- 67578 Kirkwood Heights Rd
- 67551 Kirkwood Heights Rd
- 68290 Orchard Ave
- 211 Scotts Ln
- 67730 Kirkwood Heights Rd
- 67656 Kirkwood Heights Rd
- 68511 Liston Ave
- 400 Ontario St Unit 402
- 110 6th St
- 69479 Sunset Heights
- 106 5th St
- 129-131 S Huron St
- 220 N Wabash St
- 68520 Scott St
- 301 N Huron St