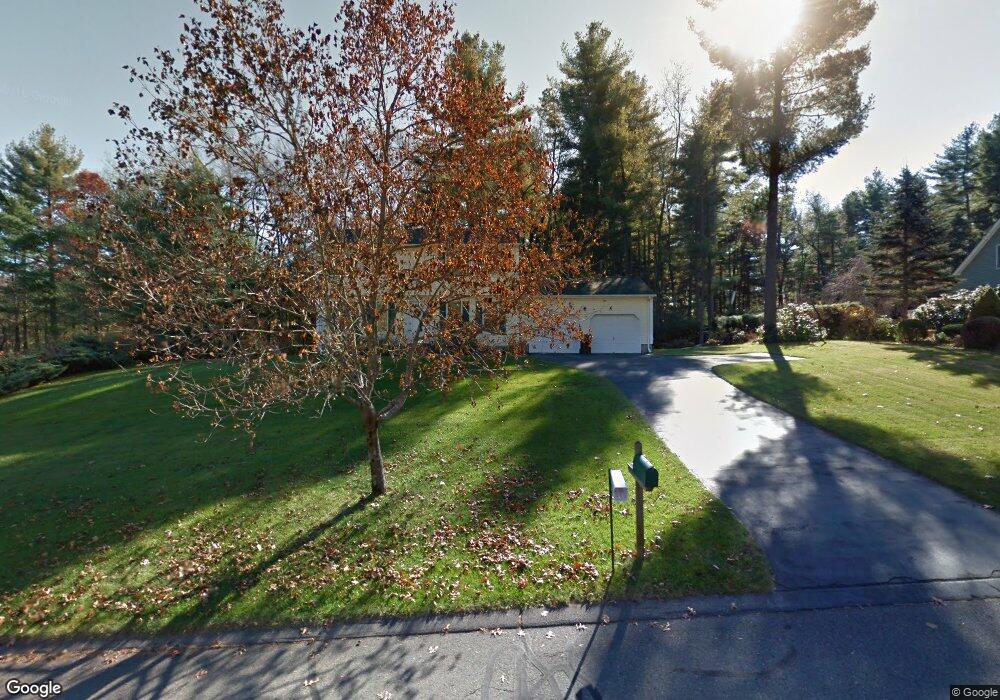
4 Emily Ln Easthampton, MA 01027
Estimated Value: $484,000 - $549,000
3
Beds
2
Baths
1,764
Sq Ft
$291/Sq Ft
Est. Value
About This Home
This home is located at 4 Emily Ln, Easthampton, MA 01027 and is currently estimated at $514,022, approximately $291 per square foot. 4 Emily Ln is a home located in Hampshire County with nearby schools including Easthampton High School, Calvary Baptist Christian School, and Tri-County Schools.
Ownership History
Date
Name
Owned For
Owner Type
Purchase Details
Closed on
Oct 1, 1992
Sold by
Boyle James F and Boyle Patricia A
Bought by
Ricci Richard A and Ricci Susan J
Current Estimated Value
Home Financials for this Owner
Home Financials are based on the most recent Mortgage that was taken out on this home.
Original Mortgage
$109,900
Interest Rate
7.83%
Mortgage Type
Purchase Money Mortgage
Create a Home Valuation Report for This Property
The Home Valuation Report is an in-depth analysis detailing your home's value as well as a comparison with similar homes in the area
Home Values in the Area
Average Home Value in this Area
Purchase History
| Date | Buyer | Sale Price | Title Company |
|---|---|---|---|
| Ricci Richard A | $157,000 | -- |
Source: Public Records
Mortgage History
| Date | Status | Borrower | Loan Amount |
|---|---|---|---|
| Closed | Ricci Richard A | $109,900 |
Source: Public Records
Tax History
| Year | Tax Paid | Tax Assessment Tax Assessment Total Assessment is a certain percentage of the fair market value that is determined by local assessors to be the total taxable value of land and additions on the property. | Land | Improvement |
|---|---|---|---|---|
| 2025 | $6,079 | $444,700 | $124,100 | $320,600 |
| 2024 | $5,859 | $432,100 | $120,400 | $311,700 |
| 2023 | $4,383 | $299,200 | $95,200 | $204,000 |
| 2022 | $4,946 | $299,200 | $95,200 | $204,000 |
| 2021 | $5,444 | $310,400 | $95,200 | $215,200 |
| 2020 | $5,314 | $299,200 | $95,200 | $204,000 |
| 2019 | $4,262 | $275,700 | $95,200 | $180,500 |
| 2018 | $4,101 | $256,300 | $90,000 | $166,300 |
| 2017 | $3,996 | $246,500 | $86,200 | $160,300 |
| 2016 | $3,989 | $255,900 | $86,200 | $169,700 |
| 2015 | $3,877 | $255,900 | $86,200 | $169,700 |
Source: Public Records
Map
Nearby Homes
Your Personal Tour Guide
Ask me questions while you tour the home.