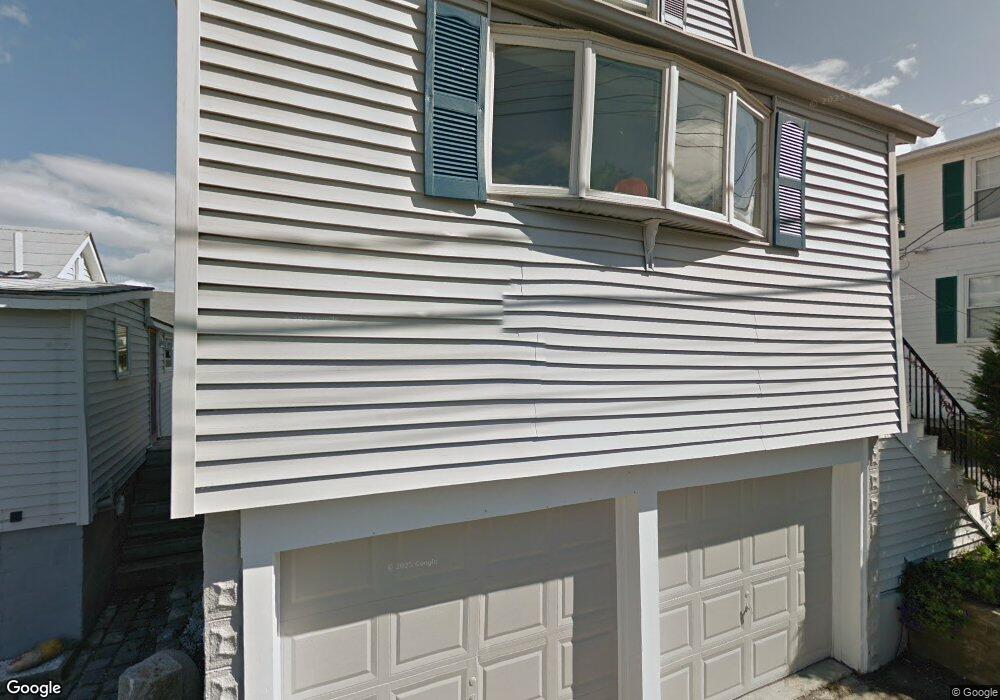
4 Fallon Way Nahant, MA 01908
Estimated Value: $598,000 - $794,000
2
Beds
1
Bath
927
Sq Ft
$735/Sq Ft
Est. Value
About This Home
This home is located at 4 Fallon Way, Nahant, MA 01908 and is currently estimated at $681,184, approximately $734 per square foot. 4 Fallon Way is a home located in Essex County with nearby schools including Johnson Elementary School, Swampscott Middle School, and Swampscott High School.
Ownership History
Date
Name
Owned For
Owner Type
Purchase Details
Closed on
Apr 29, 2010
Sold by
Fnma
Bought by
Lummen Erin M
Current Estimated Value
Purchase Details
Closed on
Mar 10, 2010
Sold by
Colantuoni Dean J
Bought by
Federal National Mortgage Association
Purchase Details
Closed on
Jul 20, 1993
Sold by
Rogers Thomas F and Rogers Suzanne T
Bought by
Fallon Way R T
Create a Home Valuation Report for This Property
The Home Valuation Report is an in-depth analysis detailing your home's value as well as a comparison with similar homes in the area
Home Values in the Area
Average Home Value in this Area
Purchase History
| Date | Buyer | Sale Price | Title Company |
|---|---|---|---|
| Lummen Erin M | $199,000 | -- | |
| Lummen Erin M | $199,000 | -- | |
| Federal National Mortgage Association | $231,176 | -- | |
| Federal National Mortgage Association | $231,176 | -- | |
| Fallon Way R T | $90,000 | -- | |
| Fallon Way R T | $90,000 | -- |
Source: Public Records
Mortgage History
| Date | Status | Borrower | Loan Amount |
|---|---|---|---|
| Open | Fallon Way R T | $232,500 | |
| Closed | Fallon Way R T | $235,000 |
Source: Public Records
Tax History
| Year | Tax Paid | Tax Assessment Tax Assessment Total Assessment is a certain percentage of the fair market value that is determined by local assessors to be the total taxable value of land and additions on the property. | Land | Improvement |
|---|---|---|---|---|
| 2025 | $5,474 | $598,200 | $473,400 | $124,800 |
| 2024 | $5,157 | $568,600 | $443,800 | $124,800 |
| 2023 | $4,586 | $504,500 | $390,500 | $114,000 |
| 2022 | $4,592 | $469,000 | $355,000 | $114,000 |
| 2021 | $4,575 | $435,300 | $325,400 | $109,900 |
| 2020 | $4,606 | $419,900 | $325,400 | $94,500 |
| 2019 | $4,259 | $390,400 | $295,900 | $94,500 |
| 2018 | $3,698 | $360,800 | $266,300 | $94,500 |
| 2017 | $3,778 | $360,800 | $266,300 | $94,500 |
| 2016 | $3,587 | $341,000 | $254,400 | $86,600 |
| 2015 | $3,527 | $323,000 | $236,400 | $86,600 |
| 2014 | $3,324 | $301,400 | $214,800 | $86,600 |
Source: Public Records
Map
Nearby Homes
- 129A Wilson Rd
- 9 Little Nahant Rd
- 51 Fox Hill Rd
- 68 Spring Rd
- 10 Lodge Rd
- 43 Maple Ave
- 66 Ocean St
- 30 Sherman Ave
- 1 Goddard Dr
- 303 Nahant Rd
- 183 Bass Point Rd
- 162 Willow Rd Unit 11
- 98 Lynnway
- 12 Chancery Ct Unit 404
- 154 Lynnway Unit 210
- 154 Lynnway Unit 401
- 154 Lynnway Unit 205
- 103 Nahant St Unit 4
- 51 Cliff St
- 95 Nahant St Unit 12
Your Personal Tour Guide
Ask me questions while you tour the home.