4 Fitch Farm Way Southampton, MA 01073
Estimated payment $1,189/month
Highlights
- Marina
- Community Stables
- Jogging Path
- Golf Course Community
- No HOA
- Cul-De-Sac
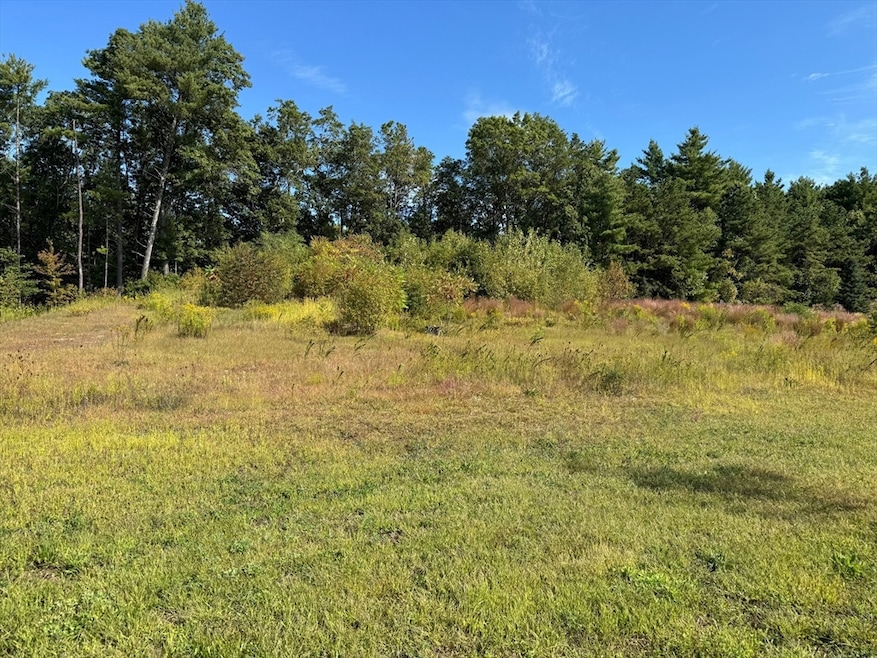
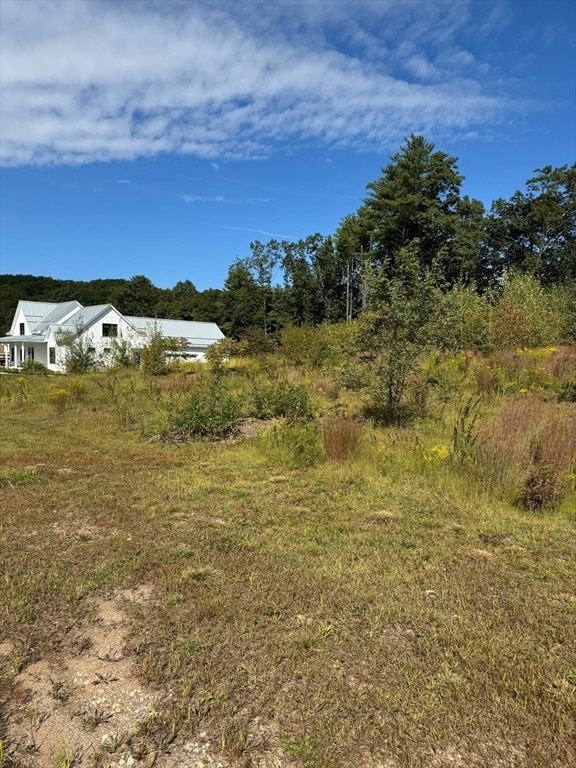
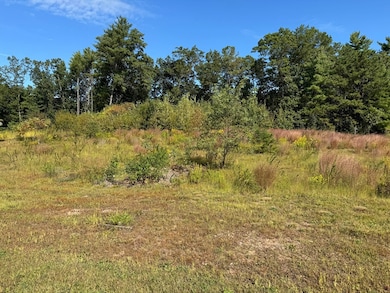
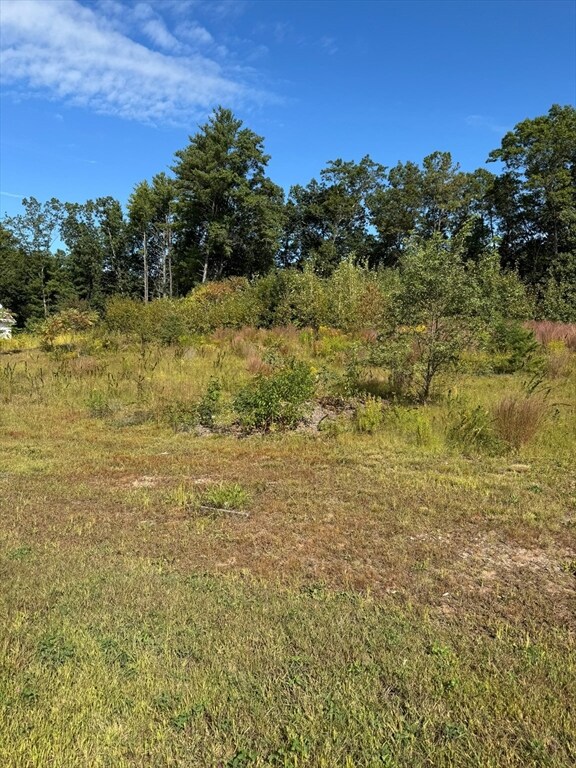
About This Lot
Lot #4 on this beautiful cul-de-sac surrounded by wooded area, convenient location to surrounding towns. Listing agent related to seller (in law)
Listing Agent
William Gryszkiewicz
LPT Realty, LLC Listed on: 11/20/2025

Property Details
Property Type
- Land
Est. Annual Taxes
- $1,300
Lot Details
- 0.93 Acre Lot
- Cul-De-Sac
- Gentle Sloping Lot
- Property is zoned RV
Location
- Property is near schools
Utilities
- Underground Utilities
- Electricity To Lot Line
- Natural Gas Not Available
- Private Water Source
- Private Sewer
Listing and Financial Details
- Assessor Parcel Number 102680,5082660
Community Details
Recreation
- Marina
- Golf Course Community
- Park
- Community Stables
- Jogging Path
Additional Features
- No Home Owners Association
- Shops
Map
Home Values in the Area
Average Home Value in this Area
Tax History
| Year | Tax Paid | Tax Assessment Tax Assessment Total Assessment is a certain percentage of the fair market value that is determined by local assessors to be the total taxable value of land and additions on the property. | Land | Improvement |
|---|---|---|---|---|
| 2025 | $1,866 | $131,700 | $131,700 | $0 |
| 2024 | $1,877 | $131,700 | $131,700 | $0 |
| 2023 | $1,887 | $131,700 | $131,700 | $0 |
| 2022 | $2,059 | $136,600 | $136,600 | $0 |
| 2021 | $1,294 | $81,000 | $81,000 | $0 |
| 2020 | $1,281 | $81,000 | $81,000 | $0 |
Property History
| Date | Event | Price | List to Sale | Price per Sq Ft |
|---|---|---|---|---|
| 11/20/2025 11/20/25 | For Sale | $205,000 | -- | -- |
Purchase History
| Date | Type | Sale Price | Title Company |
|---|---|---|---|
| Not Resolvable | $175,000 | None Available |
Source: MLS Property Information Network (MLS PIN)
MLS Number: 73455433
APN: 41 28 H
Disclaimer: Certain information contained herein is derived from information provided by parties other than Homes.com. All information provided is deemed reliable, but is not guaranteed to be accurate and should be independently verified.
![]() The property listing data and information, or the Images, set forth herein were provided to MLS Property Information Network, Inc. from third party sources, including sellers, lessors and public records, and were compiled by MLS Property Information Network, Inc. The property listing data and information, and the Images, are for the personal, non-commercial use of consumers having a good faith interest in purchasing or leasing listed properties of the type displayed to them and may not be used for any purpose other than to identify prospective properties which such consumers may have a good faith interest in purchasing or leasing. MLS Property Information Network, Inc. and its subscribers disclaim any and all representations and warranties as to the accuracy of the property listing data and information, or as to the accuracy of any of the Images, set forth herein.
The property listing data and information, or the Images, set forth herein were provided to MLS Property Information Network, Inc. from third party sources, including sellers, lessors and public records, and were compiled by MLS Property Information Network, Inc. The property listing data and information, and the Images, are for the personal, non-commercial use of consumers having a good faith interest in purchasing or leasing listed properties of the type displayed to them and may not be used for any purpose other than to identify prospective properties which such consumers may have a good faith interest in purchasing or leasing. MLS Property Information Network, Inc. and its subscribers disclaim any and all representations and warranties as to the accuracy of the property listing data and information, or as to the accuracy of any of the Images, set forth herein.
- Lot 57 White Loaf Rd
- 405 Rock Valley Rd
- 94 Pequot Rd (Rear)
- 36 County Rd
- 150 Middle Rd
- 21 Old County Rd
- 351 Apremont Hsy
- 64 Old Stage Rd
- 397 Apremont Hwy
- 369 College Hwy
- 40 Strong Rd
- 0 Char Dr
- 56 Pomeroy St
- 14 Eastwood Dr
- 7 Western View Rd
- 63 Pomeroy St
- 22 Eastwood Ln
- 59 Campbell Dr
- 101 North Rd
- Lot 5 Brickyard Rd
- 9 Couture Rd
- 57 Valley Rd
- 919 Southampton Rd
- 353 Root Rd
- 76 Westfield Rd Unit 2
- 79 Lawler St
- 1857 Northampton St Unit Holyoke, Northampton st
- 1801 Northampton St Unit 2
- 360 1/2 Tokeneke Rd
- 48 Holy Family Rd
- 134 College Hwy
- 269 Sargeant St
- 6 Laurel St Unit 2R
- 71 Bemis Rd
- 2 Vernon St Unit 3
- 507-517 Whitney Ave
- 240 Russellville Rd
- 387 S Elm St Unit 1
- 52 Fairfield Ave
- 266 Essex St