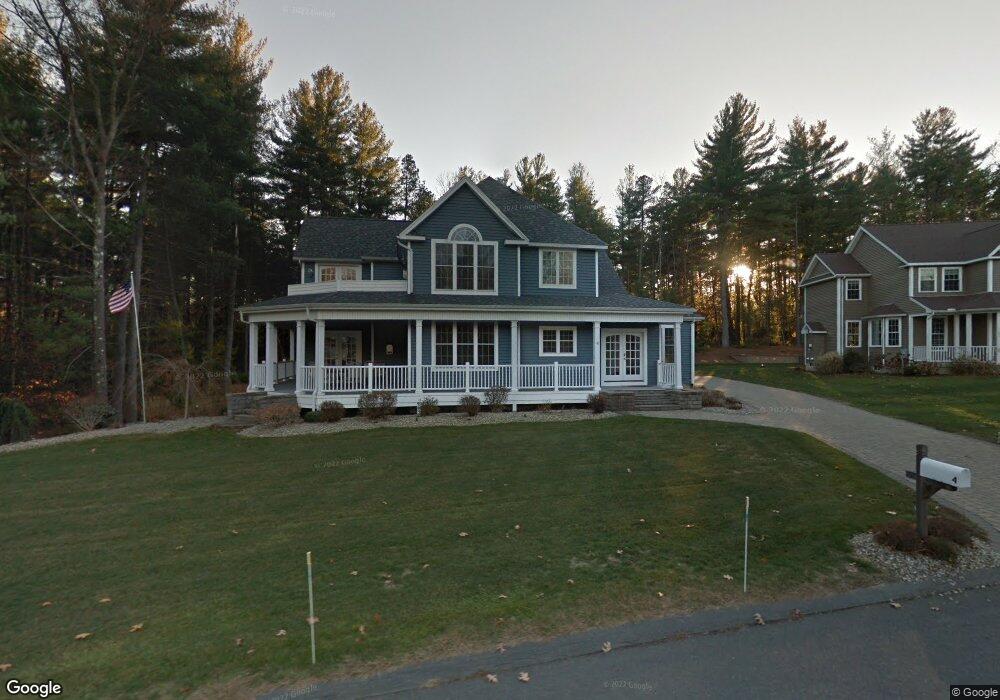
4 Fox Run Easthampton, MA 01027
Estimated Value: $809,030 - $992,000
4
Beds
4
Baths
3,057
Sq Ft
$294/Sq Ft
Est. Value
About This Home
This home is located at 4 Fox Run, Easthampton, MA 01027 and is currently estimated at $897,758, approximately $293 per square foot. 4 Fox Run is a home located in Hampshire County with nearby schools including Easthampton High School, Calvary Baptist Christian School, and Tri-County Schools.
Ownership History
Date
Name
Owned For
Owner Type
Purchase Details
Closed on
Mar 16, 2012
Sold by
Alexander Chad D and Billingsley Lisette A
Bought by
Alexander Chad D
Current Estimated Value
Home Financials for this Owner
Home Financials are based on the most recent Mortgage that was taken out on this home.
Original Mortgage
$388,000
Outstanding Balance
$266,401
Interest Rate
3.86%
Mortgage Type
New Conventional
Estimated Equity
$631,357
Purchase Details
Closed on
Jul 21, 2008
Sold by
Wonderlich Denise M and Wonderlich Eric J
Bought by
Alexander Chad D and Billingsley Lisette A
Home Financials for this Owner
Home Financials are based on the most recent Mortgage that was taken out on this home.
Original Mortgage
$340,000
Interest Rate
6.17%
Mortgage Type
Purchase Money Mortgage
Create a Home Valuation Report for This Property
The Home Valuation Report is an in-depth analysis detailing your home's value as well as a comparison with similar homes in the area
Home Values in the Area
Average Home Value in this Area
Purchase History
| Date | Buyer | Sale Price | Title Company |
|---|---|---|---|
| Alexander Chad D | -- | -- | |
| Alexander Chad D | $120,000 | -- | |
| Alexander Chad D | $120,000 | -- |
Source: Public Records
Mortgage History
| Date | Status | Borrower | Loan Amount |
|---|---|---|---|
| Open | Alexander Chad D | $388,000 | |
| Previous Owner | Alexander Chad D | $20,000 | |
| Previous Owner | Alexander Chad D | $350,000 | |
| Previous Owner | Alexander Chad D | $340,000 |
Source: Public Records
Tax History
| Year | Tax Paid | Tax Assessment Tax Assessment Total Assessment is a certain percentage of the fair market value that is determined by local assessors to be the total taxable value of land and additions on the property. | Land | Improvement |
|---|---|---|---|---|
| 2025 | $9,867 | $721,800 | $132,300 | $589,500 |
| 2024 | $9,526 | $702,500 | $128,500 | $574,000 |
| 2023 | $7,288 | $497,500 | $101,300 | $396,200 |
| 2022 | $8,224 | $497,500 | $101,300 | $396,200 |
| 2021 | $9,072 | $517,200 | $101,300 | $415,900 |
| 2020 | $8,836 | $497,500 | $101,300 | $396,200 |
| 2019 | $7,832 | $506,600 | $118,300 | $388,300 |
| 2018 | $7,558 | $472,400 | $111,700 | $360,700 |
| 2017 | $7,390 | $455,900 | $107,100 | $348,800 |
| 2016 | $6,733 | $431,900 | $107,100 | $324,800 |
| 2015 | $6,543 | $431,900 | $107,100 | $324,800 |
Source: Public Records
Map
Nearby Homes
Your Personal Tour Guide
Ask me questions while you tour the home.