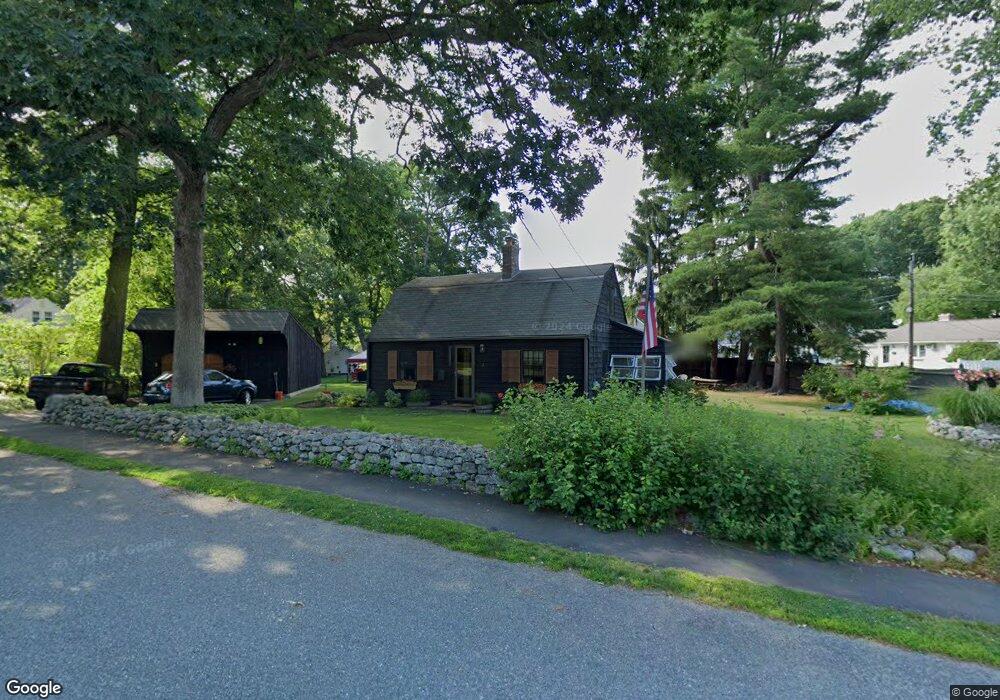
4 Gibbs St Natick, MA 01760
Estimated Value: $720,960 - $909,000
3
Beds
1
Bath
1,260
Sq Ft
$627/Sq Ft
Est. Value
About This Home
This home is located at 4 Gibbs St, Natick, MA 01760 and is currently estimated at $789,740, approximately $626 per square foot. 4 Gibbs St is a home located in Middlesex County with nearby schools including Natick High School, Wilson Middle School, and Bennett-Hemenway (Ben-Hem) Elementary School.
Ownership History
Date
Name
Owned For
Owner Type
Purchase Details
Closed on
Apr 25, 2019
Sold by
Templeton Larry J and Templeton Sandra J
Bought by
Templeton Ft 2015
Current Estimated Value
Purchase Details
Closed on
Oct 31, 2018
Sold by
Templeton Ft 2015
Bought by
Templeton Larry J and Templeton Sandra J
Purchase Details
Closed on
Sep 16, 2015
Sold by
Templeton Larry J and Templeton Sandra J
Bought by
Templeton Ft
Purchase Details
Closed on
Jun 26, 1978
Bought by
Templeton Larry J and Templeton Sandra J
Create a Home Valuation Report for This Property
The Home Valuation Report is an in-depth analysis detailing your home's value as well as a comparison with similar homes in the area
Home Values in the Area
Average Home Value in this Area
Purchase History
| Date | Buyer | Sale Price | Title Company |
|---|---|---|---|
| Templeton Ft 2015 | -- | -- | |
| Templeton Larry J | -- | -- | |
| Templeton Ft | -- | -- | |
| Templeton Larry J | -- | -- |
Source: Public Records
Mortgage History
| Date | Status | Borrower | Loan Amount |
|---|---|---|---|
| Previous Owner | Templeton Larry J | $50,000 | |
| Previous Owner | Templeton Larry J | $53,000 | |
| Previous Owner | Templeton Larry J | $25,000 |
Source: Public Records
Tax History
| Year | Tax Paid | Tax Assessment Tax Assessment Total Assessment is a certain percentage of the fair market value that is determined by local assessors to be the total taxable value of land and additions on the property. | Land | Improvement |
|---|---|---|---|---|
| 2025 | $6,888 | $575,900 | $425,500 | $150,400 |
| 2024 | $6,711 | $547,400 | $400,500 | $146,900 |
| 2023 | $6,735 | $532,800 | $385,400 | $147,400 |
| 2022 | $6,522 | $488,900 | $350,300 | $138,600 |
| 2021 | $5,340 | $461,600 | $330,300 | $131,300 |
| 2020 | $6,259 | $459,900 | $315,300 | $144,600 |
| 2019 | $7,711 | $459,900 | $315,300 | $144,600 |
| 2018 | $4,853 | $403,200 | $300,300 | $102,900 |
| 2017 | $5,055 | $374,700 | $265,400 | $109,300 |
| 2016 | $4,868 | $358,700 | $250,400 | $108,300 |
| 2015 | $4,840 | $350,200 | $250,400 | $99,800 |
Source: Public Records
Map
Nearby Homes
Your Personal Tour Guide
Ask me questions while you tour the home.