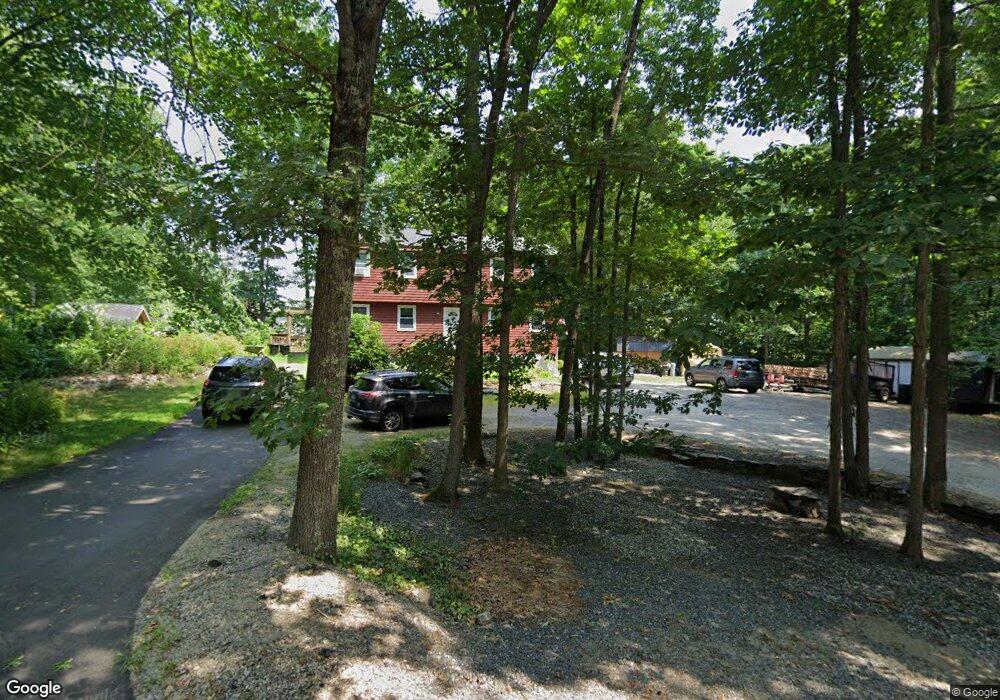
4 Glen Ridge Rd Unit A Raymond, NH 03077
Estimated Value: $322,000 - $414,000
2
Beds
2
Baths
969
Sq Ft
$366/Sq Ft
Est. Value
About This Home
This home is located at 4 Glen Ridge Rd Unit A, Raymond, NH 03077 and is currently estimated at $354,990, approximately $366 per square foot. 4 Glen Ridge Rd Unit A is a home located in Rockingham County with nearby schools including Lamprey River Elementary School, Iber Holmes Gove Middle School, and Raymond High School.
Ownership History
Date
Name
Owned For
Owner Type
Purchase Details
Closed on
Dec 7, 2023
Sold by
Lindstrom Norman C
Bought by
Larose Ashley T and Spinelli Donald J
Current Estimated Value
Home Financials for this Owner
Home Financials are based on the most recent Mortgage that was taken out on this home.
Original Mortgage
$309,294
Outstanding Balance
$304,439
Interest Rate
7.79%
Mortgage Type
FHA
Estimated Equity
$50,551
Purchase Details
Closed on
Sep 17, 2013
Sold by
Smith C Christine
Bought by
Lindstrom Norman C
Purchase Details
Closed on
May 31, 2000
Sold by
4 Glen Ridge Rd Rlty T
Bought by
Smith C Christine
Home Financials for this Owner
Home Financials are based on the most recent Mortgage that was taken out on this home.
Original Mortgage
$79,800
Interest Rate
8.14%
Mortgage Type
Purchase Money Mortgage
Create a Home Valuation Report for This Property
The Home Valuation Report is an in-depth analysis detailing your home's value as well as a comparison with similar homes in the area
Home Values in the Area
Average Home Value in this Area
Purchase History
| Date | Buyer | Sale Price | Title Company |
|---|---|---|---|
| Larose Ashley T | $315,000 | None Available | |
| Lindstrom Norman C | $119,400 | -- | |
| Smith C Christine | $88,700 | -- |
Source: Public Records
Mortgage History
| Date | Status | Borrower | Loan Amount |
|---|---|---|---|
| Open | Larose Ashley T | $309,294 | |
| Previous Owner | Smith C Christine | $10,000 | |
| Previous Owner | Smith C Christine | $79,800 |
Source: Public Records
Tax History Compared to Growth
Tax History
| Year | Tax Paid | Tax Assessment Tax Assessment Total Assessment is a certain percentage of the fair market value that is determined by local assessors to be the total taxable value of land and additions on the property. | Land | Improvement |
|---|---|---|---|---|
| 2024 | $4,562 | $208,200 | $0 | $208,200 |
| 2023 | $4,314 | $208,200 | $0 | $208,200 |
| 2022 | $3,808 | $208,200 | $0 | $208,200 |
| 2021 | $3,854 | $208,200 | $0 | $208,200 |
| 2020 | $3,396 | $129,600 | $0 | $129,600 |
| 2019 | $3,446 | $129,600 | $0 | $129,600 |
| 2018 | $3,415 | $129,600 | $0 | $129,600 |
| 2017 | $3,136 | $129,600 | $0 | $129,600 |
| 2016 | $3,077 | $129,600 | $0 | $129,600 |
| 2015 | $3,020 | $120,400 | $0 | $120,400 |
| 2014 | $2,834 | $116,500 | $0 | $116,500 |
| 2013 | $2,754 | $116,500 | $0 | $116,500 |
Source: Public Records
Map
Nearby Homes
- 19 Parker Ave
- 6 Knights Ct
- 84 W Shore Dr
- 9 Abbey Rd
- 29 Harriman Rd
- 209 New Hampshire 27
- 12 Meindl Rd Unit 2
- 5 Ham Rd
- 29 Blaisdell's Trail
- 6 Blaisdell's Trail
- 1 Blaisdell's Trail
- 17 Blaisdell's Trail
- 11 Blaisdell's Trail
- 31 Blaisdell's Trail Unit 37-18
- 47 Long Hill Rd
- 16 Old Manchester Rd
- 17 Pawtuckaway Rd Unit Lot 17A
- 1 Pawtuckaway Rd Unit lot 1
- 13 Pawtuckaway Rd Unit Lot 13
- 5 Pawtuckaway Rd Unit Lot 5
- 4 Glen Ridge Rd Unit B
- 4 Glen Ridge Rd Unit 4A
- 4 Glen Ridge Rd Unit A/ Left Side
- 3 Donna Ln
- 5 Donna Ln
- 8 Glen Ridge Rd
- 3 Glen Ridge Rd
- 65 Harriman Hill Rd
- 67 Harriman Hill Rd
- 5 Glen Ridge Rd
- 7 Glen Ridge Rd
- 69 Harriman Hill Rd
- 4 Donna Ln
- 6 Donna Ln
- 63 Harriman Hill Rd
- 7 Donna Ln
- 2 Donna Ln
- 8 Donna Ln
- 70 Harriman Hill Rd
- 9 Glen Ridge Rd