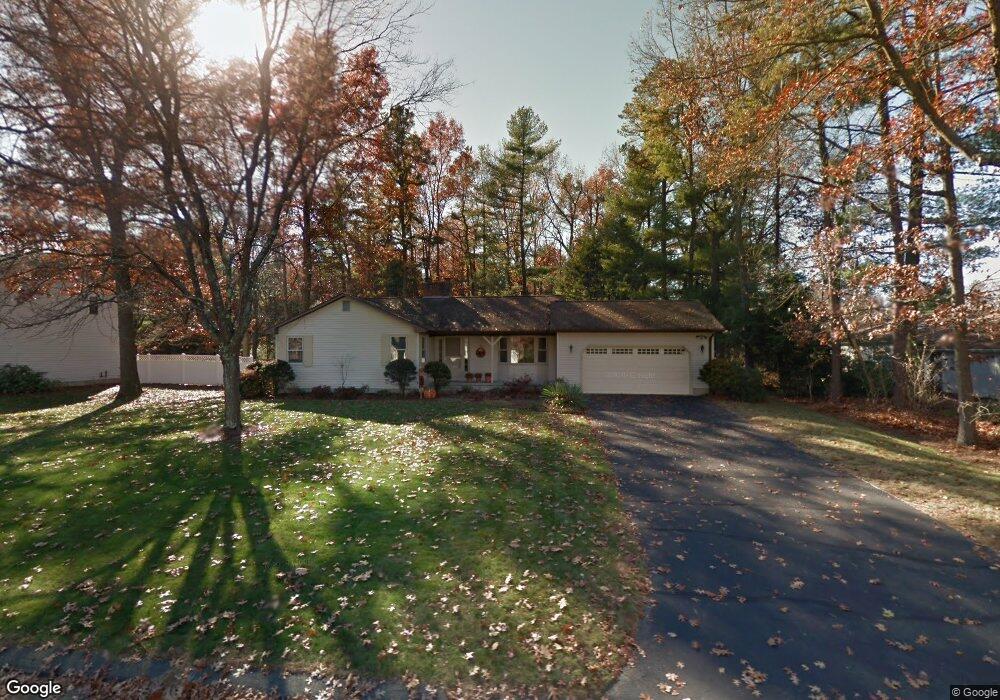
4 Golden Dr Easthampton, MA 01027
Estimated Value: $408,000 - $486,341
3
Beds
3
Baths
1,346
Sq Ft
$339/Sq Ft
Est. Value
About This Home
This home is located at 4 Golden Dr, Easthampton, MA 01027 and is currently estimated at $456,585, approximately $339 per square foot. 4 Golden Dr is a home located in Hampshire County with nearby schools including Easthampton High School, Calvary Baptist Christian School, and Tri-County Schools.
Ownership History
Date
Name
Owned For
Owner Type
Purchase Details
Closed on
May 11, 2001
Sold by
Gwinner Edward H
Bought by
Ansanitis Debra J and Ansanitis Francis
Current Estimated Value
Home Financials for this Owner
Home Financials are based on the most recent Mortgage that was taken out on this home.
Original Mortgage
$180,000
Outstanding Balance
$66,465
Interest Rate
6.88%
Mortgage Type
Purchase Money Mortgage
Estimated Equity
$390,120
Purchase Details
Closed on
Mar 5, 1984
Bought by
Prosciak Jill I
Create a Home Valuation Report for This Property
The Home Valuation Report is an in-depth analysis detailing your home's value as well as a comparison with similar homes in the area
Home Values in the Area
Average Home Value in this Area
Purchase History
| Date | Buyer | Sale Price | Title Company |
|---|---|---|---|
| Ansanitis Debra J | $285,000 | -- | |
| Prosciak Jill I | $5,000 | -- |
Source: Public Records
Mortgage History
| Date | Status | Borrower | Loan Amount |
|---|---|---|---|
| Open | Prosciak Jill I | $180,000 | |
| Previous Owner | Prosciak Jill I | $20,000 |
Source: Public Records
Tax History Compared to Growth
Tax History
| Year | Tax Paid | Tax Assessment Tax Assessment Total Assessment is a certain percentage of the fair market value that is determined by local assessors to be the total taxable value of land and additions on the property. | Land | Improvement |
|---|---|---|---|---|
| 2025 | $5,974 | $437,000 | $132,400 | $304,600 |
| 2024 | $5,768 | $425,400 | $128,600 | $296,800 |
| 2023 | $4,361 | $297,700 | $101,700 | $196,000 |
| 2022 | $4,921 | $297,700 | $101,700 | $196,000 |
| 2021 | $5,392 | $307,400 | $101,700 | $205,700 |
| 2020 | $5,287 | $297,700 | $101,700 | $196,000 |
| 2019 | $4,683 | $302,900 | $118,600 | $184,300 |
| 2018 | $4,488 | $280,500 | $111,700 | $168,800 |
| 2017 | $4,385 | $270,500 | $107,500 | $163,000 |
| 2016 | $4,217 | $270,500 | $107,500 | $163,000 |
| 2015 | $4,098 | $270,500 | $107,500 | $163,000 |
Source: Public Records
Map
Nearby Homes