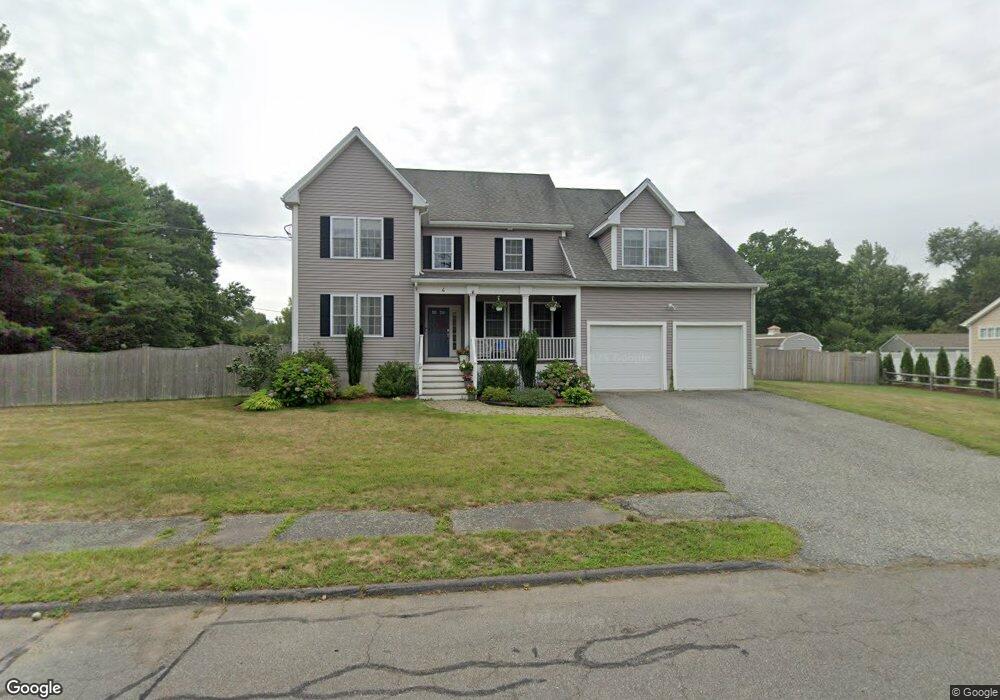
4 Graystone Dr Danvers, MA 01923
Estimated Value: $804,000 - $1,146,000
3
Beds
3
Baths
1,926
Sq Ft
$520/Sq Ft
Est. Value
About This Home
This home is located at 4 Graystone Dr, Danvers, MA 01923 and is currently estimated at $1,002,036, approximately $520 per square foot. 4 Graystone Dr is a home located in Essex County with nearby schools including Danvers High School, St. Mary of the Annunciation School, and St. John's Prep.
Ownership History
Date
Name
Owned For
Owner Type
Purchase Details
Closed on
Aug 11, 2022
Sold by
Kassiotis Judi L and Kassiotis Robert E
Bought by
Kassiotis
Current Estimated Value
Purchase Details
Closed on
Dec 17, 2008
Sold by
Hawthorne Rt and Macdonald
Bought by
Kassiotis Robert E and Kassiotis Judi L
Purchase Details
Closed on
Jun 23, 2006
Sold by
Hagerty James J Est and Hagerty
Bought by
Thomson Dev Corp
Purchase Details
Closed on
Feb 26, 2004
Sold by
Northeast Hosp Corp
Bought by
Hagerty James J
Purchase Details
Closed on
Feb 28, 1995
Sold by
Samson Olin D
Bought by
Beverly Hospital Corp
Create a Home Valuation Report for This Property
The Home Valuation Report is an in-depth analysis detailing your home's value as well as a comparison with similar homes in the area
Home Values in the Area
Average Home Value in this Area
Purchase History
| Date | Buyer | Sale Price | Title Company |
|---|---|---|---|
| Kassiotis | -- | None Available | |
| Kassiotis Robert E | $650,000 | -- | |
| Thomson Dev Corp | $300,000 | -- | |
| Hagerty James J | $265,000 | -- | |
| Beverly Hospital Corp | $105,000 | -- |
Source: Public Records
Mortgage History
| Date | Status | Borrower | Loan Amount |
|---|---|---|---|
| Previous Owner | Beverly Hospital Corp | $175,000 | |
| Previous Owner | Beverly Hospital Corp | $320,000 |
Source: Public Records
Tax History
| Year | Tax Paid | Tax Assessment Tax Assessment Total Assessment is a certain percentage of the fair market value that is determined by local assessors to be the total taxable value of land and additions on the property. | Land | Improvement |
|---|---|---|---|---|
| 2025 | $10,067 | $916,000 | $405,900 | $510,100 |
| 2024 | $9,786 | $880,800 | $399,200 | $481,600 |
| 2023 | $9,494 | $808,000 | $365,300 | $442,700 |
| 2022 | $9,310 | $735,400 | $324,800 | $410,600 |
| 2021 | $9,086 | $680,600 | $320,800 | $359,800 |
| 2020 | $9,824 | $752,200 | $320,800 | $431,400 |
| 2019 | $9,414 | $708,900 | $291,100 | $417,800 |
| 2018 | $9,204 | $679,800 | $291,100 | $388,700 |
| 2017 | $8,698 | $613,000 | $250,600 | $362,400 |
| 2016 | $8,372 | $589,600 | $237,100 | $352,500 |
| 2015 | $8,189 | $549,200 | $216,800 | $332,400 |
Source: Public Records
Map
Nearby Homes
Your Personal Tour Guide
Ask me questions while you tour the home.