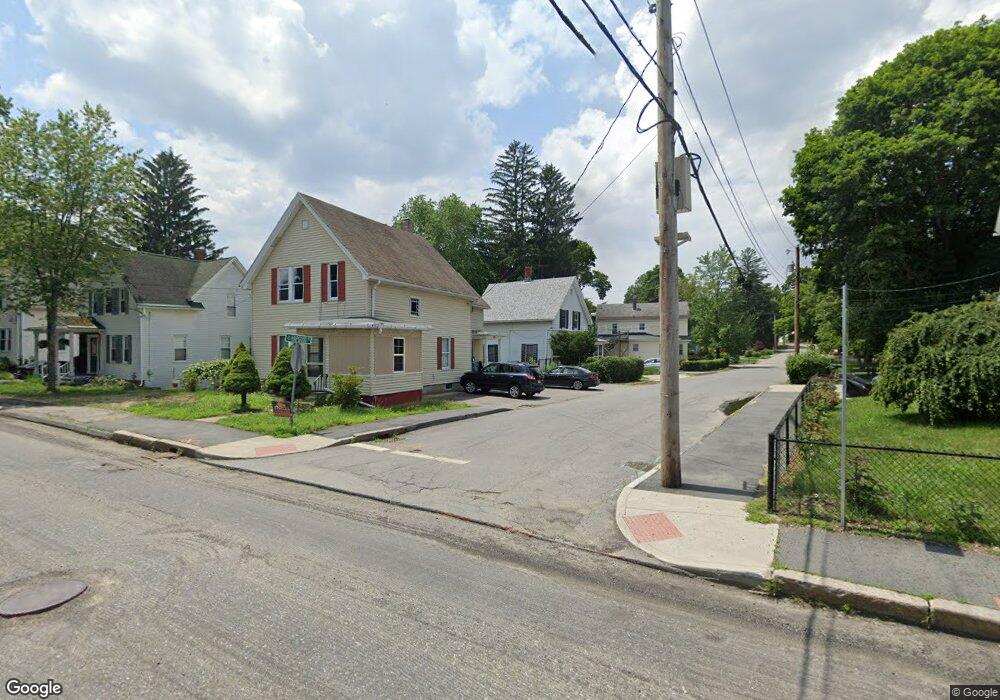
4 Hapgood St Hudson, MA 01749
Estimated Value: $447,000 - $525,000
3
Beds
2
Baths
943
Sq Ft
$505/Sq Ft
Est. Value
About This Home
This home is located at 4 Hapgood St, Hudson, MA 01749 and is currently estimated at $475,949, approximately $504 per square foot. 4 Hapgood St is a home located in Middlesex County with nearby schools including David J. Quinn Middle School, Hudson High School, and First Steps Children's Center.
Ownership History
Date
Name
Owned For
Owner Type
Purchase Details
Closed on
Aug 19, 2020
Sold by
Mcdonald Joan F Est
Bought by
Denson Michele M
Current Estimated Value
Purchase Details
Closed on
Jun 19, 2000
Sold by
Tracy Gregory L and Tracy Donis I
Bought by
Mcdonald Joan F
Home Financials for this Owner
Home Financials are based on the most recent Mortgage that was taken out on this home.
Original Mortgage
$30,000
Interest Rate
8.24%
Mortgage Type
Purchase Money Mortgage
Purchase Details
Closed on
Oct 21, 1994
Sold by
Colley Thomas and Colley Elizabeth W
Bought by
Tracy Gregory L and Tracy Donis I
Home Financials for this Owner
Home Financials are based on the most recent Mortgage that was taken out on this home.
Original Mortgage
$93,600
Interest Rate
8.49%
Mortgage Type
Purchase Money Mortgage
Create a Home Valuation Report for This Property
The Home Valuation Report is an in-depth analysis detailing your home's value as well as a comparison with similar homes in the area
Home Values in the Area
Average Home Value in this Area
Purchase History
| Date | Buyer | Sale Price | Title Company |
|---|---|---|---|
| Denson Michele M | -- | None Available | |
| Denson Michele M | -- | None Available | |
| Mcdonald Joan F | $169,900 | -- | |
| Tracy Gregory L | $117,000 | -- |
Source: Public Records
Mortgage History
| Date | Status | Borrower | Loan Amount |
|---|---|---|---|
| Previous Owner | Tracy Gregory L | $30,000 | |
| Previous Owner | Tracy Gregory L | $93,600 |
Source: Public Records
Tax History Compared to Growth
Tax History
| Year | Tax Paid | Tax Assessment Tax Assessment Total Assessment is a certain percentage of the fair market value that is determined by local assessors to be the total taxable value of land and additions on the property. | Land | Improvement |
|---|---|---|---|---|
| 2025 | $5,362 | $386,300 | $150,900 | $235,400 |
| 2024 | $5,061 | $361,500 | $137,200 | $224,300 |
| 2023 | $4,843 | $331,700 | $132,000 | $199,700 |
| 2022 | $4,138 | $260,900 | $120,000 | $140,900 |
| 2021 | $4,048 | $244,000 | $114,300 | $129,700 |
| 2020 | $3,802 | $228,900 | $112,100 | $116,800 |
| 2019 | $3,883 | $228,000 | $112,100 | $115,900 |
| 2018 | $4,338 | $208,800 | $106,700 | $102,100 |
| 2017 | $3,400 | $194,300 | $101,600 | $92,700 |
| 2016 | $3,299 | $190,800 | $101,600 | $89,200 |
| 2015 | $3,216 | $186,200 | $101,600 | $84,600 |
| 2014 | $3,033 | $174,100 | $89,100 | $85,000 |
Source: Public Records
Map
Nearby Homes
- 55 Cottage St
- 1 Barracks Rd Unit 1
- 2 Barracks Rd Unit 2
- 2 Linden St
- 4 Linden St
- 133 Lincoln St
- 65 Main St
- 17 School St Unit C
- 17 School St Unit A
- 16 Barnes Blvd Unit 16
- 136 Central St Unit C6
- 21 Gates Ave
- 16 Houghton St
- 110 River St
- 248 Main St Unit 207
- 248 Main St Unit 210
- 200 Manning St Unit 6C
- 200 Manning St Unit 14B
- 56 Park St
- 4 Richard Rd