4 Hemlock St Oxford, MA 01540
Estimated Value: $470,173 - $557,000
3
Beds
2
Baths
1,488
Sq Ft
$337/Sq Ft
Est. Value
About This Home
This home is located at 4 Hemlock St, Oxford, MA 01540 and is currently estimated at $500,793, approximately $336 per square foot. 4 Hemlock St is a home located in Worcester County with nearby schools including Alfred M Chaffee, Oxford High School, and Clara Barton Elementary School.
Ownership History
Date
Name
Owned For
Owner Type
Purchase Details
Closed on
Dec 19, 2011
Sold by
Henry Michael P and Henry Elaine I
Bought by
Stuart Lisa M and Stuart Jason C
Current Estimated Value
Home Financials for this Owner
Home Financials are based on the most recent Mortgage that was taken out on this home.
Original Mortgage
$229,042
Outstanding Balance
$156,680
Interest Rate
4.01%
Mortgage Type
Purchase Money Mortgage
Estimated Equity
$344,113
Purchase Details
Closed on
Sep 14, 1990
Sold by
Hesselton Michael D
Bought by
Henry Michael P
Purchase Details
Closed on
Apr 17, 1987
Sold by
Bartkus Sandra A
Bought by
Hesselton Michael C
Create a Home Valuation Report for This Property
The Home Valuation Report is an in-depth analysis detailing your home's value as well as a comparison with similar homes in the area
Home Values in the Area
Average Home Value in this Area
Purchase History
| Date | Buyer | Sale Price | Title Company |
|---|---|---|---|
| Stuart Lisa M | $235,000 | -- | |
| Henry Michael P | $116,900 | -- | |
| Hesselton Michael C | $112,000 | -- |
Source: Public Records
Mortgage History
| Date | Status | Borrower | Loan Amount |
|---|---|---|---|
| Open | Stuart Lisa M | $229,042 | |
| Previous Owner | Hesselton Michael C | $168,500 | |
| Previous Owner | Hesselton Michael C | $189,000 |
Source: Public Records
Tax History Compared to Growth
Tax History
| Year | Tax Paid | Tax Assessment Tax Assessment Total Assessment is a certain percentage of the fair market value that is determined by local assessors to be the total taxable value of land and additions on the property. | Land | Improvement |
|---|---|---|---|---|
| 2025 | $46 | $361,600 | $86,500 | $275,100 |
| 2024 | $4,345 | $322,300 | $80,300 | $242,000 |
| 2023 | $4,253 | $311,800 | $71,700 | $240,100 |
| 2022 | $4,279 | $264,800 | $64,300 | $200,500 |
| 2021 | $3,982 | $240,900 | $61,100 | $179,800 |
| 2020 | $3,842 | $230,600 | $61,100 | $169,500 |
| 2019 | $3,990 | $234,300 | $61,000 | $173,300 |
| 2018 | $3,706 | $214,600 | $61,000 | $153,600 |
| 2017 | $3,715 | $220,500 | $61,000 | $159,500 |
| 2016 | $3,733 | $220,500 | $61,000 | $159,500 |
| 2015 | $3,482 | $220,500 | $61,000 | $159,500 |
| 2014 | $3,426 | $228,400 | $61,000 | $167,400 |
Source: Public Records
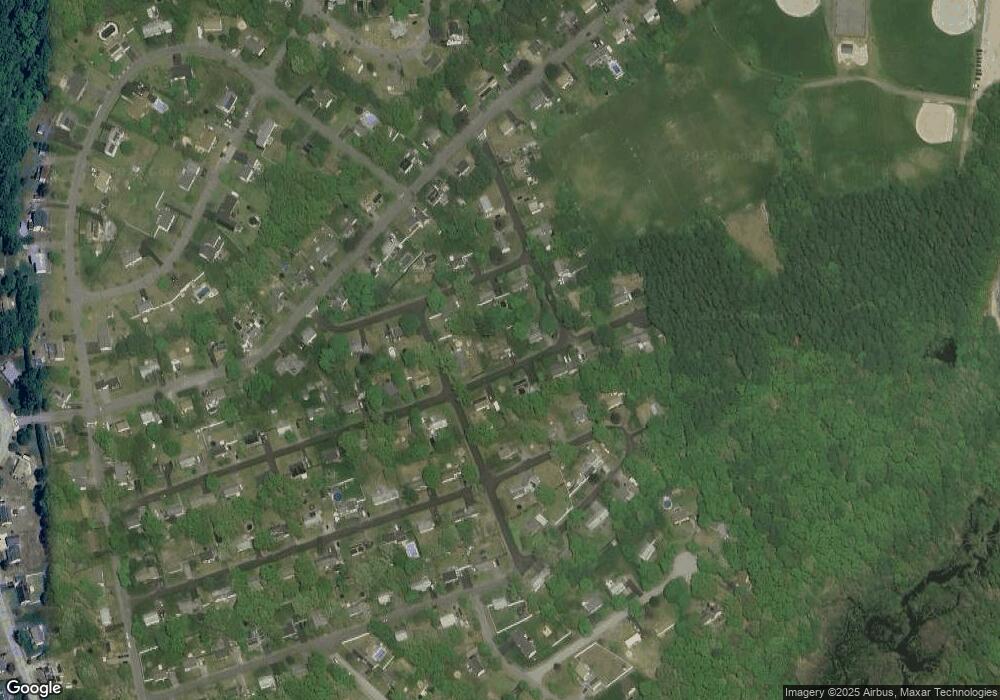
Map
Nearby Homes