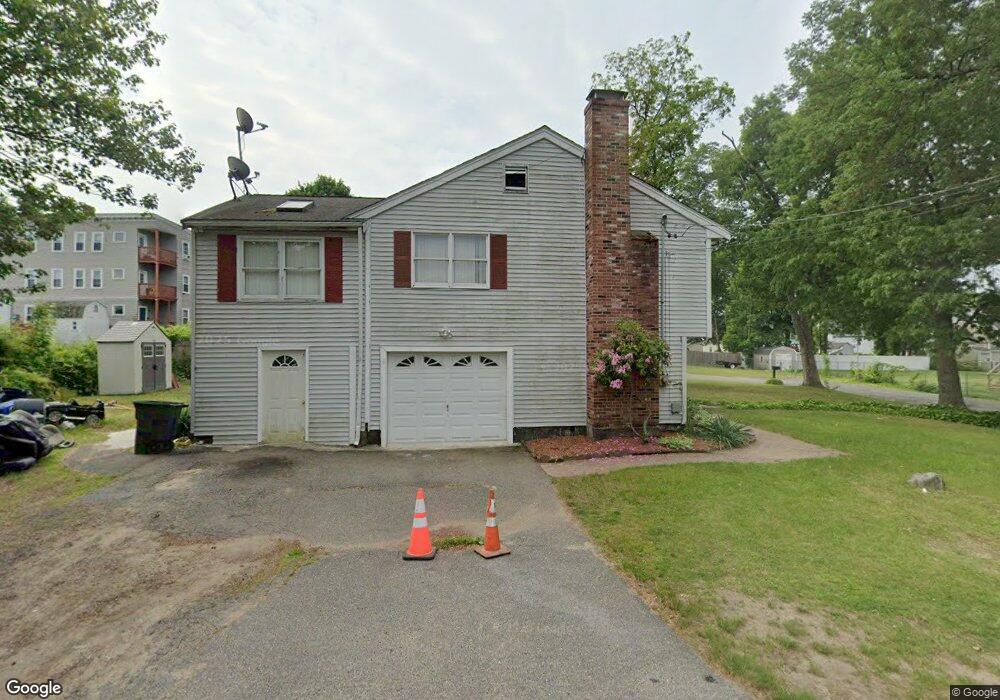
4 Hill Place Brockton, MA 02302
Campello NeighborhoodEstimated Value: $442,000 - $614,000
3
Beds
2
Baths
1,144
Sq Ft
$468/Sq Ft
Est. Value
About This Home
This home is located at 4 Hill Place, Brockton, MA 02302 and is currently estimated at $535,494, approximately $468 per square foot. 4 Hill Place is a home located in Plymouth County with nearby schools including Davis K-8 School, John F. Kennedy Elementary School, and South Middle School.
Ownership History
Date
Name
Owned For
Owner Type
Purchase Details
Closed on
Sep 24, 2003
Sold by
Hebshie Frederick
Bought by
Fernandes Ilda V
Current Estimated Value
Home Financials for this Owner
Home Financials are based on the most recent Mortgage that was taken out on this home.
Original Mortgage
$150,000
Interest Rate
6.29%
Mortgage Type
Purchase Money Mortgage
Purchase Details
Closed on
Feb 20, 2003
Sold by
Fernandes John A and Fernandes Joao A
Bought by
Hebshie Frederick
Purchase Details
Closed on
Mar 13, 1998
Sold by
Fhlmc
Bought by
Cruz Eugenio and Fernandes Joana A
Home Financials for this Owner
Home Financials are based on the most recent Mortgage that was taken out on this home.
Original Mortgage
$109,816
Interest Rate
7.03%
Mortgage Type
Purchase Money Mortgage
Purchase Details
Closed on
Jun 5, 1997
Sold by
Weekes Oscar W and Weekes Fhlmc
Bought by
Fhlmc
Create a Home Valuation Report for This Property
The Home Valuation Report is an in-depth analysis detailing your home's value as well as a comparison with similar homes in the area
Home Values in the Area
Average Home Value in this Area
Purchase History
| Date | Buyer | Sale Price | Title Company |
|---|---|---|---|
| Fernandes Ilda V | $250,000 | -- | |
| Hebshie Frederick | $40,000 | -- | |
| Cruz Eugenio | $110,000 | -- | |
| Fhlmc | $105,131 | -- |
Source: Public Records
Mortgage History
| Date | Status | Borrower | Loan Amount |
|---|---|---|---|
| Open | Fhlmc | $15,000 | |
| Open | Fhlmc | $188,500 | |
| Closed | Fhlmc | $150,000 | |
| Previous Owner | Fhlmc | $109,816 |
Source: Public Records
Tax History Compared to Growth
Tax History
| Year | Tax Paid | Tax Assessment Tax Assessment Total Assessment is a certain percentage of the fair market value that is determined by local assessors to be the total taxable value of land and additions on the property. | Land | Improvement |
|---|---|---|---|---|
| 2025 | $6,134 | $506,500 | $156,400 | $350,100 |
| 2024 | $5,789 | $481,600 | $156,400 | $325,200 |
| 2023 | $5,598 | $431,300 | $106,500 | $324,800 |
| 2022 | $5,049 | $361,400 | $96,800 | $264,600 |
| 2021 | $4,947 | $341,200 | $88,700 | $252,500 |
| 2020 | $5,077 | $335,100 | $78,300 | $256,800 |
| 2019 | $4,859 | $312,700 | $74,300 | $238,400 |
| 2018 | $4,463 | $277,900 | $74,300 | $203,600 |
| 2017 | $4,126 | $256,300 | $74,300 | $182,000 |
| 2016 | $4,123 | $237,500 | $70,900 | $166,600 |
| 2015 | $4,022 | $221,600 | $70,900 | $150,700 |
| 2014 | $3,802 | $209,700 | $70,900 | $138,800 |
Source: Public Records
Map
Nearby Homes
- 10 Hill Place
- 50 Beach St
- 44 Beach St
- 30 Brentwood Ave
- 15 Brentwood Ave
- 60 Beach St
- 20 Brentwood Ave
- 36 Beach St
- 124 Riverview St
- 124 Riverview St Unit 1
- 120 Riverview St Unit 2
- 35 Ferris Ave
- 45 Ferris Ave
- 49 Beach St
- 126 Riverview St
- 126 Riverview St Unit 2
- 43 Beach St
- 122 Concord St
- 114 Riverview St
- 118 Concord St