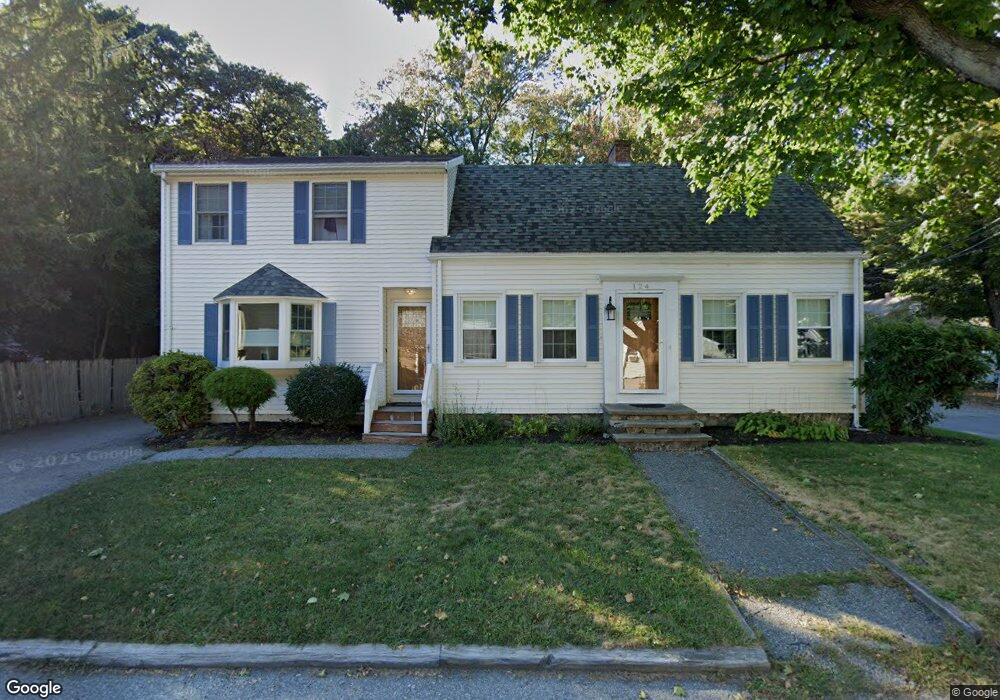
4 Holland Rd Wakefield, MA 01880
East Side NeighborhoodEstimated Value: $718,000 - $805,397
3
Beds
2
Baths
1,116
Sq Ft
$687/Sq Ft
Est. Value
About This Home
This home is located at 4 Holland Rd, Wakefield, MA 01880 and is currently estimated at $766,849, approximately $687 per square foot. 4 Holland Rd is a home located in Middlesex County with nearby schools including Wakefield Memorial High School, St Joseph School, and St. Patrick Elementary School.
Ownership History
Date
Name
Owned For
Owner Type
Purchase Details
Closed on
Aug 2, 2018
Sold by
Donaher Marie M Est
Bought by
Mercer Stephen E
Current Estimated Value
Home Financials for this Owner
Home Financials are based on the most recent Mortgage that was taken out on this home.
Original Mortgage
$336,000
Outstanding Balance
$291,802
Interest Rate
4.5%
Mortgage Type
New Conventional
Estimated Equity
$475,047
Create a Home Valuation Report for This Property
The Home Valuation Report is an in-depth analysis detailing your home's value as well as a comparison with similar homes in the area
Home Values in the Area
Average Home Value in this Area
Purchase History
| Date | Buyer | Sale Price | Title Company |
|---|---|---|---|
| Mercer Stephen E | $420,000 | -- |
Source: Public Records
Mortgage History
| Date | Status | Borrower | Loan Amount |
|---|---|---|---|
| Open | Mercer Stephen E | $336,000 |
Source: Public Records
Tax History
| Year | Tax Paid | Tax Assessment Tax Assessment Total Assessment is a certain percentage of the fair market value that is determined by local assessors to be the total taxable value of land and additions on the property. | Land | Improvement |
|---|---|---|---|---|
| 2025 | $8,811 | $776,300 | $390,300 | $386,000 |
| 2024 | $7,937 | $705,500 | $363,000 | $342,500 |
| 2023 | $6,825 | $581,800 | $338,800 | $243,000 |
| 2022 | $6,400 | $519,500 | $302,500 | $217,000 |
| 2021 | $6,136 | $482,000 | $276,600 | $205,400 |
| 2020 | $5,772 | $452,000 | $259,400 | $192,600 |
| 2019 | $5,412 | $421,800 | $242,100 | $179,700 |
| 2018 | $5,220 | $403,100 | $231,300 | $171,800 |
| 2017 | $4,908 | $376,700 | $216,100 | $160,600 |
| 2016 | $4,912 | $364,100 | $213,400 | $150,700 |
| 2015 | $4,586 | $340,200 | $199,400 | $140,800 |
| 2014 | $4,242 | $331,900 | $194,500 | $137,400 |
Source: Public Records
Map
Nearby Homes
- 1 Sidney St
- 0 Everett St
- 34 Stark Ave
- 824 Main St Unit 1
- 61 Nahant St
- 21 Herbert St Unit A
- 1 Traverse St Unit E
- 62 Golden Hills Rd
- 15 Belmont Rd
- 35 Richardson St Unit 2
- 9 Lovis Ave
- 350 Water St
- 9 Cyrus St
- 12 Lovis Ave
- 7 West St
- 10 Wakefield Ave Unit B
- 176 Bay State Rd
- 24 Mount Zion Rd
- 11 Ludlow Ave
- 69 Foundry St Unit 310
Your Personal Tour Guide
Ask me questions while you tour the home.