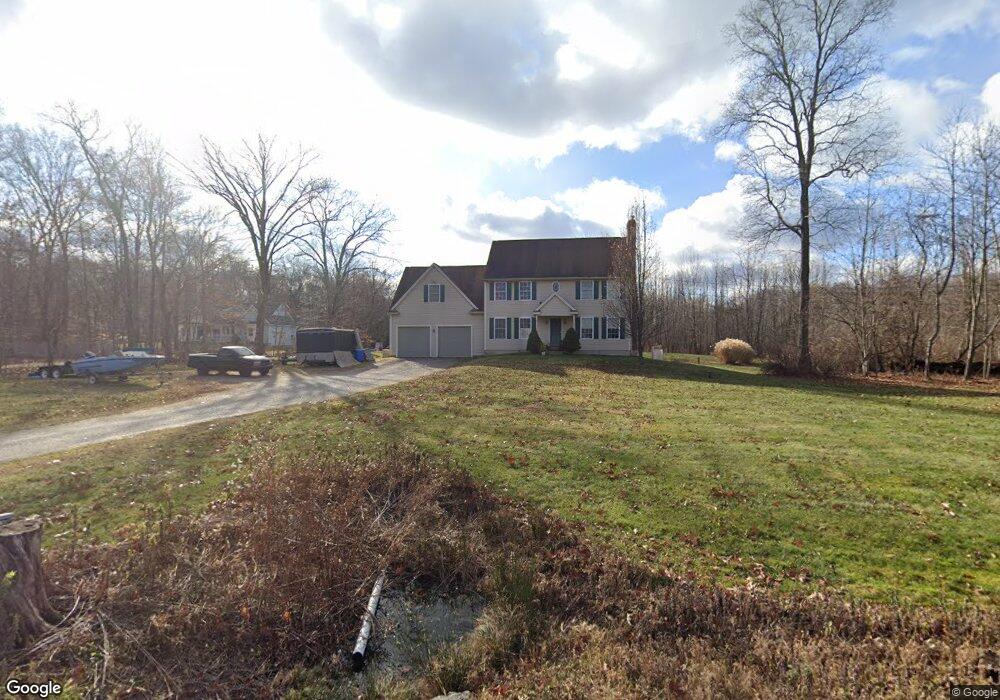
4 Hunt Rd Columbia, CT 06237
Estimated Value: $499,092 - $558,000
3
Beds
3
Baths
2,286
Sq Ft
$231/Sq Ft
Est. Value
About This Home
This home is located at 4 Hunt Rd, Columbia, CT 06237 and is currently estimated at $527,773, approximately $230 per square foot. 4 Hunt Rd is a home located in Tolland County with nearby schools including Horace W. Porter School.
Ownership History
Date
Name
Owned For
Owner Type
Purchase Details
Closed on
Jul 5, 2022
Sold by
Strout Thomas A
Bought by
Strout Carol L
Current Estimated Value
Home Financials for this Owner
Home Financials are based on the most recent Mortgage that was taken out on this home.
Original Mortgage
$35,000
Outstanding Balance
$26,011
Interest Rate
5.78%
Mortgage Type
Stand Alone Refi Refinance Of Original Loan
Estimated Equity
$501,762
Purchase Details
Closed on
Nov 1, 2000
Sold by
Robinson Bldrs Inc
Bought by
Strout Thomas
Create a Home Valuation Report for This Property
The Home Valuation Report is an in-depth analysis detailing your home's value as well as a comparison with similar homes in the area
Home Values in the Area
Average Home Value in this Area
Purchase History
| Date | Buyer | Sale Price | Title Company |
|---|---|---|---|
| Strout Carol L | -- | None Available | |
| Strout Carol L | -- | None Available | |
| Strout Thomas | $250,000 | -- | |
| Strout Thomas | $250,000 | -- |
Source: Public Records
Mortgage History
| Date | Status | Borrower | Loan Amount |
|---|---|---|---|
| Open | Strout Carol L | $35,000 | |
| Closed | Strout Carol L | $35,000 | |
| Previous Owner | Strout Thomas | $123,000 | |
| Previous Owner | Strout Thomas | $20,050 | |
| Previous Owner | Strout Thomas | $214,000 |
Source: Public Records
Tax History
| Year | Tax Paid | Tax Assessment Tax Assessment Total Assessment is a certain percentage of the fair market value that is determined by local assessors to be the total taxable value of land and additions on the property. | Land | Improvement |
|---|---|---|---|---|
| 2025 | $7,087 | $242,130 | $46,480 | $195,650 |
| 2024 | $6,809 | $242,130 | $46,480 | $195,650 |
| 2023 | $6,274 | $242,130 | $46,480 | $195,650 |
| 2022 | $6,264 | $242,130 | $46,480 | $195,650 |
| 2021 | $5,939 | $202,500 | $47,100 | $155,400 |
| 2020 | $5,939 | $202,500 | $47,100 | $155,400 |
| 2019 | $5,939 | $202,500 | $47,100 | $155,400 |
| 2018 | $5,939 | $202,500 | $47,100 | $155,400 |
| 2017 | $5,848 | $202,500 | $47,100 | $155,400 |
| 2016 | $5,554 | $202,400 | $47,100 | $155,300 |
| 2015 | $5,491 | $202,400 | $47,100 | $155,300 |
| 2014 | $5,491 | $202,400 | $47,100 | $155,300 |
Source: Public Records
Map
Nearby Homes
- 2 Summit Rd
- 00 Zola Rd
- 64 Loveland Rd
- 249 Wall St
- 13 Basket Shop Rd
- 555 Wall St
- 1 Church St
- 2 Church St
- 10 Lakeview Park
- 146 Lake Shore Dr
- 161 Lake Williams Dr
- 127 U S 6
- 23 Thompson Hill Rd
- 65 Trumbull Hwy
- 0 Ryan Terrace Unit 24144446
- 17 Route 6
- 0 Chowanec Rd
- 0 Deepwood Dr
- 25 Woodland Dr
- 12 Rondaly Rd
Your Personal Tour Guide
Ask me questions while you tour the home.