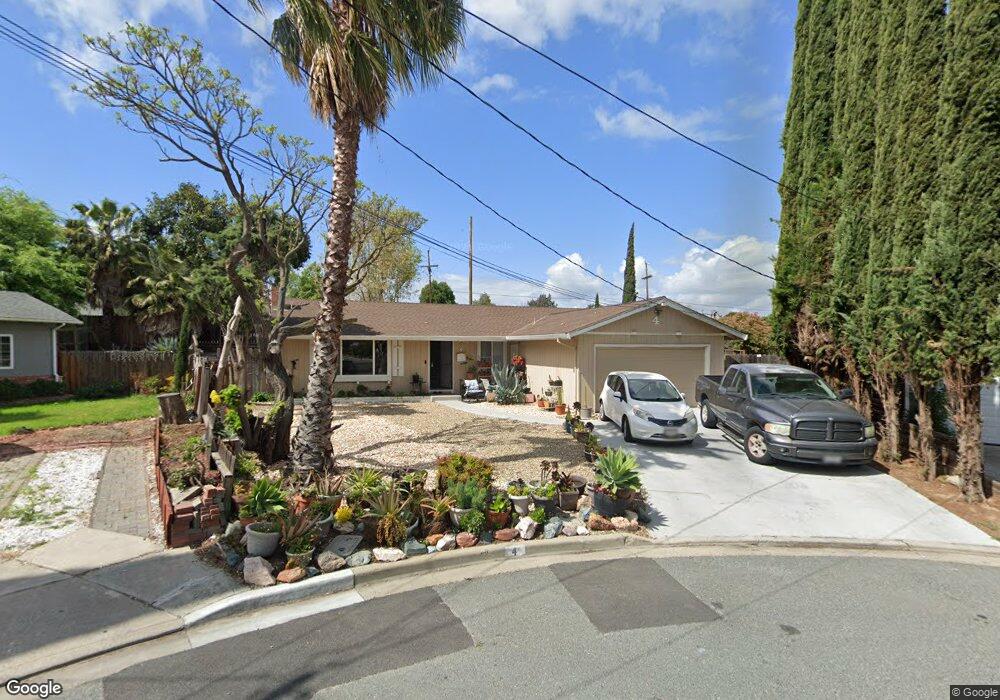
4 Inland Ct Antioch, CA 94509
North Antioch NeighborhoodEstimated Value: $490,810 - $544,000
3
Beds
2
Baths
1,200
Sq Ft
$423/Sq Ft
Est. Value
About This Home
This home is located at 4 Inland Ct, Antioch, CA 94509 and is currently estimated at $507,953, approximately $423 per square foot. 4 Inland Ct is a home located in Contra Costa County with nearby schools including Kimball Elementary School, Antioch Middle School, and Antioch High School.
Ownership History
Date
Name
Owned For
Owner Type
Purchase Details
Closed on
Jun 13, 2019
Sold by
Johnson Charles and Harris Lisa L
Bought by
Chandler Billie
Current Estimated Value
Purchase Details
Closed on
Jan 22, 1997
Sold by
Johnson Arma Jean
Bought by
Johnson Arma Jean
Purchase Details
Closed on
Nov 6, 1996
Sold by
Satran James
Bought by
Johnson Arma Jean
Home Financials for this Owner
Home Financials are based on the most recent Mortgage that was taken out on this home.
Original Mortgage
$73,500
Interest Rate
8.14%
Mortgage Type
Purchase Money Mortgage
Purchase Details
Closed on
Nov 1, 1996
Sold by
Sonia Carrillo
Bought by
Johnson Arma Jean
Home Financials for this Owner
Home Financials are based on the most recent Mortgage that was taken out on this home.
Original Mortgage
$73,500
Interest Rate
8.14%
Mortgage Type
Purchase Money Mortgage
Create a Home Valuation Report for This Property
The Home Valuation Report is an in-depth analysis detailing your home's value as well as a comparison with similar homes in the area
Home Values in the Area
Average Home Value in this Area
Purchase History
| Date | Buyer | Sale Price | Title Company |
|---|---|---|---|
| Chandler Billie | -- | None Available | |
| Johnson Arma Jean | -- | -- | |
| Johnson Arma Jean | -- | Old Republic Title Company | |
| Johnson Arma Jean | $105,000 | Old Republic Title Company |
Source: Public Records
Mortgage History
| Date | Status | Borrower | Loan Amount |
|---|---|---|---|
| Previous Owner | Johnson Arma Jean | $73,500 |
Source: Public Records
Tax History Compared to Growth
Tax History
| Year | Tax Paid | Tax Assessment Tax Assessment Total Assessment is a certain percentage of the fair market value that is determined by local assessors to be the total taxable value of land and additions on the property. | Land | Improvement |
|---|---|---|---|---|
| 2025 | $4,230 | $341,159 | $171,477 | $169,682 |
| 2024 | $3,225 | $334,470 | $168,115 | $166,355 |
| 2023 | $3,225 | $247,427 | $117,822 | $129,605 |
| 2022 | $3,177 | $242,576 | $115,512 | $127,064 |
| 2021 | $9,249 | $237,821 | $113,248 | $124,573 |
| 2019 | $2,442 | $172,210 | $68,884 | $103,326 |
| 2018 | $2,358 | $168,834 | $67,534 | $101,300 |
| 2017 | $2,295 | $165,524 | $66,210 | $99,314 |
| 2016 | $2,235 | $162,279 | $64,912 | $97,367 |
| 2015 | $2,208 | $159,842 | $63,937 | $95,905 |
| 2014 | $2,748 | $139,489 | $39,851 | $99,638 |
Source: Public Records
Map
Nearby Homes
- 1300 Cavallo Rd
- 89 W Lake Dr
- 22 S Lake Dr
- 301 Grangnelli Ave
- 1702 Wisner Dr
- 310 Nash Ave
- 914 Marie Ave
- 912 Minaker Dr
- 1808 Terrace Dr
- 1105 E 13th St
- 1920 Glenwood Dr
- 54 E 13th St
- 1925 Alpha Way
- 45 E 13th St
- 1816 Parsons Ln
- 1913 Garden Ct
- 25 Apollo Ct
- 2008 Cavallo Rd
- 2020 Crestwood Dr
- 1251 Hillcrest Ave
- 3 Inland Ct
- 34 W Lake Dr
- 2 Inland Ct
- 42 W Lake Dr
- 1601 Cavallo Rd Unit A
- 1601 Cavallo Rd
- 420 E St Unit 14TH
- 30 W Lake Dr
- 421 E 14th St
- 421 E St Unit 14TH
- 1600 Bruce St
- 41 W Lake Dr
- 416 E 14th St
- 33 W Lake Dr
- 416 E St Unit 14TH
- 1605 Cavallo Rd Unit A
- 46 W Lake Dr
- 26 W Lake Dr
- 417 E St Unit 14TH
- 1308 Cavallo Rd