4 Ironwood Dr Gilford, NH 03249
Estimated Value: $614,000 - $703,000
3
Beds
2
Baths
1,776
Sq Ft
$365/Sq Ft
Est. Value
About This Home
This home is located at 4 Ironwood Dr, Gilford, NH 03249 and is currently estimated at $649,033, approximately $365 per square foot. 4 Ironwood Dr is a home located in Belknap County with nearby schools including Gilford Elementary School, Gilford Middle School, and Gilford High School.
Ownership History
Date
Name
Owned For
Owner Type
Purchase Details
Closed on
Apr 19, 2024
Sold by
Morris Lisa M and Morris John W
Bought by
J W & Lisa M Morris Irt and Morris
Current Estimated Value
Purchase Details
Closed on
Jun 2, 1999
Sold by
Downes David and Downes Sharon
Bought by
Morris Lisa and Morris John
Home Financials for this Owner
Home Financials are based on the most recent Mortgage that was taken out on this home.
Original Mortgage
$135,350
Interest Rate
6.85%
Create a Home Valuation Report for This Property
The Home Valuation Report is an in-depth analysis detailing your home's value as well as a comparison with similar homes in the area
Home Values in the Area
Average Home Value in this Area
Purchase History
| Date | Buyer | Sale Price | Title Company |
|---|---|---|---|
| J W & Lisa M Morris Irt | -- | None Available | |
| Morris Lisa | $142,500 | -- | |
| Morris Lisa | $142,500 | -- |
Source: Public Records
Mortgage History
| Date | Status | Borrower | Loan Amount |
|---|---|---|---|
| Previous Owner | Morris Lisa | $143,239 | |
| Previous Owner | Morris Lisa | $135,350 |
Source: Public Records
Tax History Compared to Growth
Tax History
| Year | Tax Paid | Tax Assessment Tax Assessment Total Assessment is a certain percentage of the fair market value that is determined by local assessors to be the total taxable value of land and additions on the property. | Land | Improvement |
|---|---|---|---|---|
| 2024 | $5,734 | $509,700 | $168,100 | $341,600 |
| 2023 | $5,250 | $509,700 | $168,100 | $341,600 |
| 2022 | $4,619 | $377,090 | $104,790 | $272,300 |
| 2021 | $4,631 | $377,090 | $104,790 | $272,300 |
| 2020 | $4,485 | $298,420 | $74,820 | $223,600 |
| 2019 | $4,495 | $283,430 | $69,830 | $213,600 |
| 2018 | $3,880 | $227,690 | $43,890 | $183,800 |
| 2017 | $3,930 | $227,690 | $43,890 | $183,800 |
| 2016 | $4,081 | $227,370 | $47,870 | $179,500 |
| 2015 | $4,010 | $223,170 | $47,870 | $175,300 |
| 2011 | $3,539 | $190,770 | $47,870 | $142,900 |
Source: Public Records
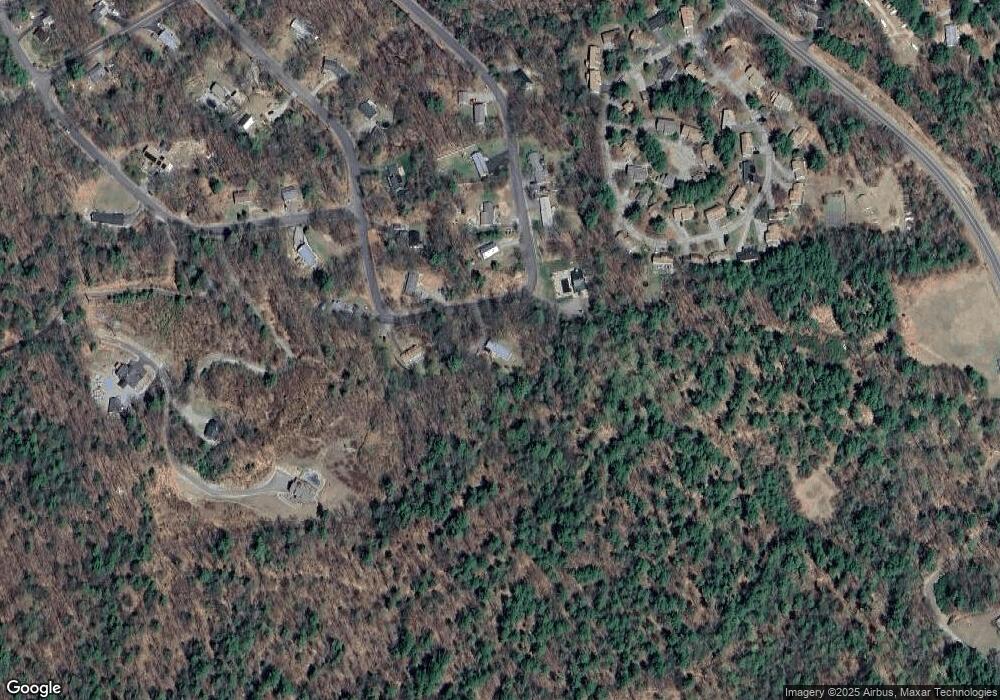
Map
Nearby Homes
- 2761 Lake Shore Rd Unit 45
- 6 Cumberland Rd Unit 22
- 35 Cumberland Rd
- 90 Briarcliff Rd
- 2696 Lake Shore Rd Unit 108
- 235 Cumberland Rd
- 36-3 Checkerberry Ln
- 20 E Marina Rd
- 1 Woodbridge Lsp Rd
- 4 Cheshire Cir
- 32 Lake Shore Park Rd
- 124 Tate Rd
- 1756 Mount Major Hwy
- 34 Hermit Rd
- 55 White Birch Dr
- 197 Scenic Dr Unit 3
- 663 Cherry Valley Rd Unit 311
- 26 Chalet Dr
- 12 Beach St
- 22 Silver St