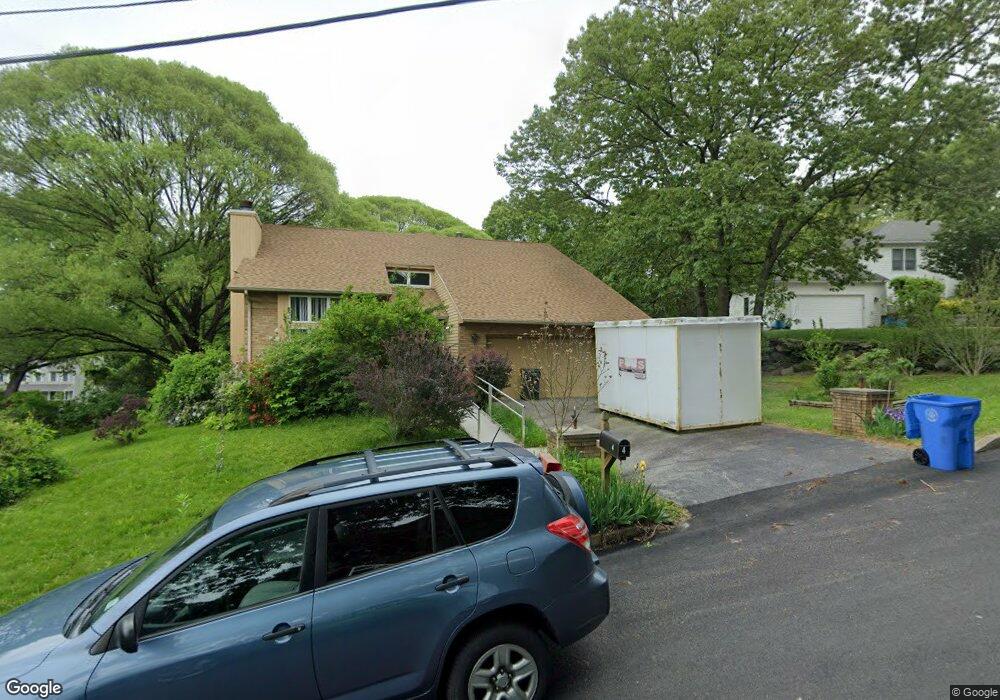
4 Jessica Ct Cranston, RI 02920
Thornton NeighborhoodEstimated Value: $571,707 - $649,000
3
Beds
3
Baths
2,206
Sq Ft
$275/Sq Ft
Est. Value
About This Home
This home is located at 4 Jessica Ct, Cranston, RI 02920 and is currently estimated at $607,677, approximately $275 per square foot. 4 Jessica Ct is a home located in Providence County with nearby schools including Stone Hill School, Western Hills Middle School, and Cranston High School West.
Ownership History
Date
Name
Owned For
Owner Type
Purchase Details
Closed on
Dec 15, 1992
Sold by
Berkowitz Richard
Bought by
Hopla Richard E
Current Estimated Value
Home Financials for this Owner
Home Financials are based on the most recent Mortgage that was taken out on this home.
Original Mortgage
$162,400
Interest Rate
8.16%
Purchase Details
Closed on
Mar 16, 1989
Sold by
Ronn David Invest
Bought by
Berkowitz Richard C
Home Financials for this Owner
Home Financials are based on the most recent Mortgage that was taken out on this home.
Original Mortgage
$162,000
Interest Rate
10.46%
Create a Home Valuation Report for This Property
The Home Valuation Report is an in-depth analysis detailing your home's value as well as a comparison with similar homes in the area
Home Values in the Area
Average Home Value in this Area
Purchase History
| Date | Buyer | Sale Price | Title Company |
|---|---|---|---|
| Hopla Richard E | $217,000 | -- | |
| Berkowitz Richard C | $202,500 | -- |
Source: Public Records
Mortgage History
| Date | Status | Borrower | Loan Amount |
|---|---|---|---|
| Closed | Berkowitz Richard C | $162,400 | |
| Previous Owner | Berkowitz Richard C | $162,000 |
Source: Public Records
Tax History
| Year | Tax Paid | Tax Assessment Tax Assessment Total Assessment is a certain percentage of the fair market value that is determined by local assessors to be the total taxable value of land and additions on the property. | Land | Improvement |
|---|---|---|---|---|
| 2025 | $7,136 | $514,100 | $163,700 | $350,400 |
| 2024 | $6,997 | $514,100 | $163,700 | $350,400 |
| 2023 | $6,834 | $361,600 | $117,000 | $244,600 |
| 2022 | $6,693 | $361,600 | $117,000 | $244,600 |
| 2021 | $6,509 | $361,600 | $117,000 | $244,600 |
| 2020 | $7,151 | $344,300 | $117,000 | $227,300 |
| 2019 | $7,151 | $344,300 | $117,000 | $227,300 |
| 2018 | $6,986 | $344,300 | $117,000 | $227,300 |
| 2017 | $7,075 | $308,400 | $100,300 | $208,100 |
| 2016 | $6,924 | $308,400 | $100,300 | $208,100 |
| 2015 | $6,924 | $308,400 | $100,300 | $208,100 |
| 2014 | $7,720 | $338,000 | $96,100 | $241,900 |
Source: Public Records
Map
Nearby Homes
- 93 Elena St
- 00 Burton St
- 83 Valente Dr
- 244 Stony Acre Dr
- 0 Macera Dr
- 333 Phenix Ave
- 82 Clemence St
- 822 Atwood Ave
- 0 Clemence St
- 54 Randall St
- 20 Woodland Ave
- 50 Clemence St Unit 50
- 0 Plainfield Pike Unit 1374314
- 9 Baker St
- 14 New Hampshire St
- 73 Maple Ave
- 17 Woodview Dr
- 9 Southern St
- 1603 Plainfield Pike Unit G8
- 1603 Plainfield Pike Unit A2
Your Personal Tour Guide
Ask me questions while you tour the home.