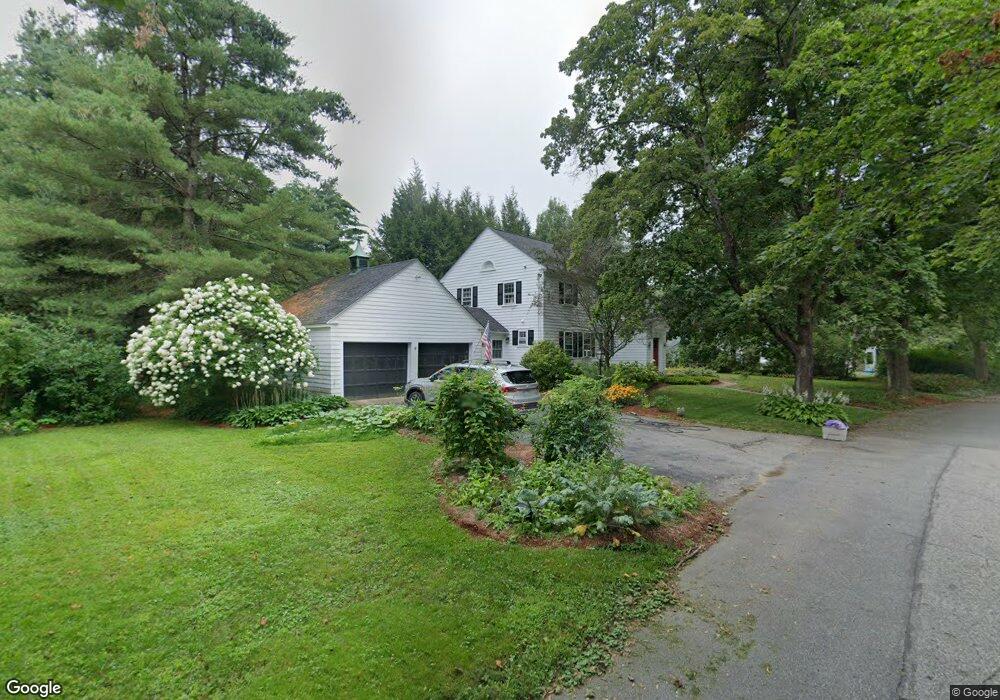
4 Jordan Ave Concord, NH 03301
South End NeighborhoodEstimated Value: $608,000 - $627,908
4
Beds
3
Baths
1,860
Sq Ft
$333/Sq Ft
Est. Value
About This Home
This home is located at 4 Jordan Ave, Concord, NH 03301 and is currently estimated at $620,227, approximately $333 per square foot. 4 Jordan Ave is a home located in Merrimack County with nearby schools including Abbot-Downing School, Rundlett Middle School, and Concord High School.
Ownership History
Date
Name
Owned For
Owner Type
Purchase Details
Closed on
Mar 21, 2013
Sold by
Morrison Laura L and Morrison Scott M
Bought by
Morrison Ret
Current Estimated Value
Purchase Details
Closed on
Jan 31, 1997
Sold by
Dupee Matthew and Dupee Jacqueline
Bought by
Morrison Scott M and Morrison Laura L
Home Financials for this Owner
Home Financials are based on the most recent Mortgage that was taken out on this home.
Original Mortgage
$132,000
Interest Rate
7.65%
Mortgage Type
Purchase Money Mortgage
Create a Home Valuation Report for This Property
The Home Valuation Report is an in-depth analysis detailing your home's value as well as a comparison with similar homes in the area
Home Values in the Area
Average Home Value in this Area
Purchase History
| Date | Buyer | Sale Price | Title Company |
|---|---|---|---|
| Morrison Ret | -- | -- | |
| Morrison Scott M | $165,000 | -- |
Source: Public Records
Mortgage History
| Date | Status | Borrower | Loan Amount |
|---|---|---|---|
| Previous Owner | Morrison Scott M | $100,000 | |
| Previous Owner | Morrison Scott M | $30,500 | |
| Previous Owner | Morrison Scott M | $125,000 | |
| Previous Owner | Morrison Scott M | $132,000 |
Source: Public Records
Tax History
| Year | Tax Paid | Tax Assessment Tax Assessment Total Assessment is a certain percentage of the fair market value that is determined by local assessors to be the total taxable value of land and additions on the property. | Land | Improvement |
|---|---|---|---|---|
| 2025 | $12,380 | $425,300 | $124,500 | $300,800 |
| 2024 | $11,738 | $423,900 | $124,500 | $299,400 |
| 2023 | $11,386 | $423,900 | $124,500 | $299,400 |
| 2022 | $10,237 | $395,400 | $124,500 | $270,900 |
| 2021 | $9,686 | $385,600 | $124,500 | $261,100 |
| 2020 | $9,494 | $354,800 | $98,000 | $256,800 |
| 2019 | $8,953 | $322,300 | $101,700 | $220,600 |
| 2018 | $8,711 | $309,000 | $102,200 | $206,800 |
| 2017 | $8,543 | $302,500 | $102,200 | $200,300 |
| 2016 | $8,113 | $293,200 | $100,300 | $192,900 |
| 2015 | $7,617 | $276,700 | $108,800 | $167,900 |
| 2014 | $7,418 | $276,700 | $108,800 | $167,900 |
| 2013 | -- | $276,700 | $108,800 | $167,900 |
| 2012 | -- | $277,400 | $114,600 | $162,800 |
Source: Public Records
Map
Nearby Homes
- 0 South St Unit 4969509
- 33 Joffre St
- 40 Nivelle St
- 289 South St
- 335 S Main St
- 47 Noyes St
- 273-279 S Main St
- 47 South St
- 30 Longmeadow Dr
- 58 S State St
- 111 -113 South Main St
- 7-9 Myrtle St
- 25 N Spring St
- 5 Holly Cir
- 5 Windchime Dr
- 9 Forest St
- 21 Fairfield Dr
- 22 Fairfield Dr
- 20 Fairfield Dr
- 135 Liberty St
Your Personal Tour Guide
Ask me questions while you tour the home.