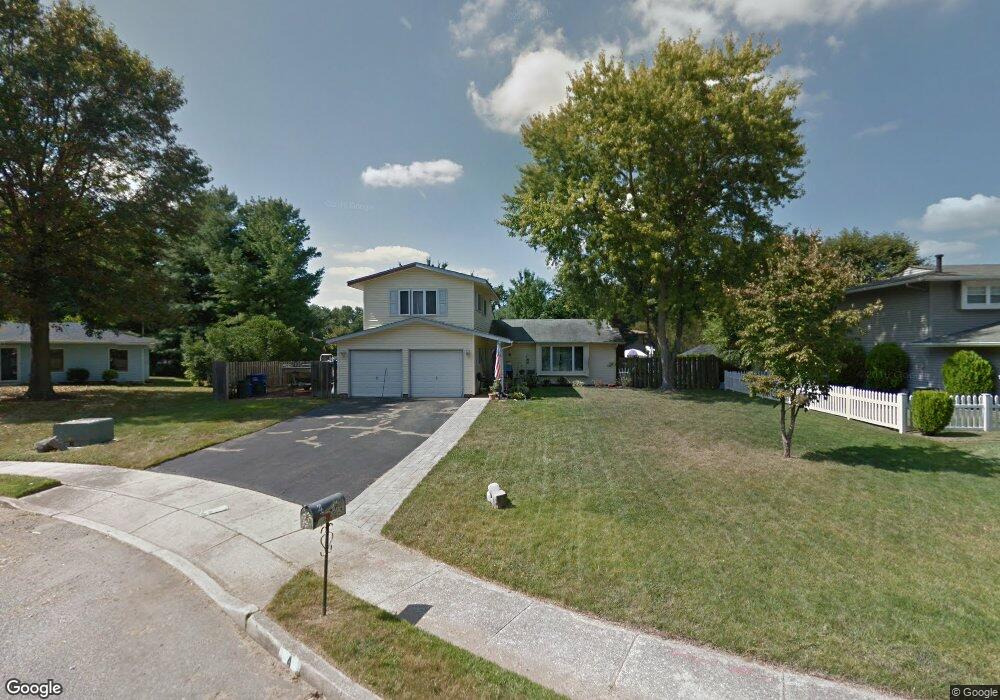
4 Kent Ct Mount Holly, NJ 08060
Estimated Value: $344,078 - $449,000
--
Bed
--
Bath
1,576
Sq Ft
$261/Sq Ft
Est. Value
About This Home
This home is located at 4 Kent Ct, Mount Holly, NJ 08060 and is currently estimated at $412,020, approximately $261 per square foot. 4 Kent Ct is a home located in Burlington County with nearby schools including Eastampton Township Community School, Rancocas Valley Regional High School, and Sacred Heart School.
Ownership History
Date
Name
Owned For
Owner Type
Purchase Details
Closed on
Mar 4, 2005
Sold by
Pallante John J and Pallante Virginia A
Bought by
Pallante Brian K and Pallante Marianne
Current Estimated Value
Home Financials for this Owner
Home Financials are based on the most recent Mortgage that was taken out on this home.
Original Mortgage
$218,500
Outstanding Balance
$111,800
Interest Rate
5.75%
Mortgage Type
Fannie Mae Freddie Mac
Estimated Equity
$300,220
Create a Home Valuation Report for This Property
The Home Valuation Report is an in-depth analysis detailing your home's value as well as a comparison with similar homes in the area
Home Values in the Area
Average Home Value in this Area
Purchase History
| Date | Buyer | Sale Price | Title Company |
|---|---|---|---|
| Pallante Brian K | $273,125 | Group 21 Title Agency | |
| -- | $273,100 | -- |
Source: Public Records
Mortgage History
| Date | Status | Borrower | Loan Amount |
|---|---|---|---|
| Open | -- | $218,500 |
Source: Public Records
Tax History Compared to Growth
Tax History
| Year | Tax Paid | Tax Assessment Tax Assessment Total Assessment is a certain percentage of the fair market value that is determined by local assessors to be the total taxable value of land and additions on the property. | Land | Improvement |
|---|---|---|---|---|
| 2025 | $7,023 | $219,800 | $47,100 | $172,700 |
| 2024 | $7,238 | $219,800 | $47,100 | $172,700 |
| 2023 | $7,238 | $219,800 | $47,100 | $172,700 |
| 2022 | $6,996 | $219,800 | $47,100 | $172,700 |
| 2021 | $6,998 | $219,800 | $47,100 | $172,700 |
| 2020 | $7,018 | $219,800 | $47,100 | $172,700 |
| 2019 | $6,847 | $219,800 | $47,100 | $172,700 |
| 2018 | $6,862 | $219,800 | $47,100 | $172,700 |
| 2017 | $6,796 | $219,800 | $47,100 | $172,700 |
| 2016 | $6,737 | $219,800 | $47,100 | $172,700 |
| 2015 | $6,750 | $219,800 | $47,100 | $172,700 |
| 2014 | $6,585 | $219,800 | $47,100 | $172,700 |
Source: Public Records
Map
Nearby Homes