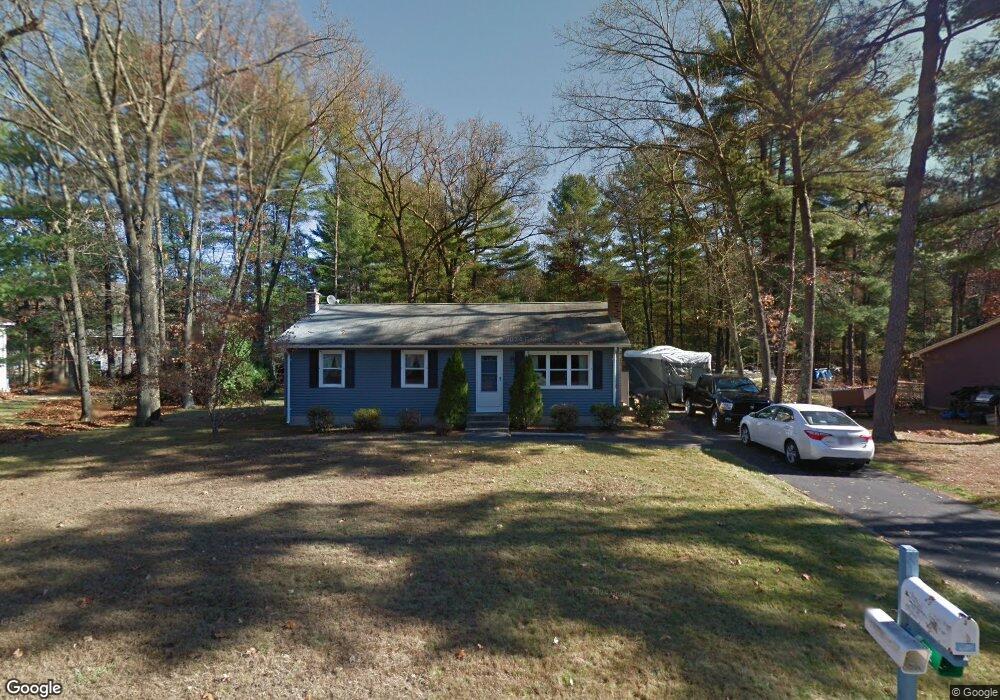
4 Kimberly Ln Easthampton, MA 01027
Estimated Value: $353,733 - $411,000
3
Beds
2
Baths
1,008
Sq Ft
$380/Sq Ft
Est. Value
About This Home
This home is located at 4 Kimberly Ln, Easthampton, MA 01027 and is currently estimated at $382,683, approximately $379 per square foot. 4 Kimberly Ln is a home located in Hampshire County with nearby schools including Easthampton High School, Calvary Baptist Christian School, and Tri-County Schools.
Ownership History
Date
Name
Owned For
Owner Type
Purchase Details
Closed on
Aug 19, 1999
Sold by
Nissen Jonathan S and Nissen Karen A
Bought by
Laduc Linda M
Current Estimated Value
Home Financials for this Owner
Home Financials are based on the most recent Mortgage that was taken out on this home.
Original Mortgage
$144,875
Interest Rate
7.6%
Mortgage Type
Purchase Money Mortgage
Purchase Details
Closed on
Aug 18, 1998
Sold by
Viamari Joseph P and Viamari Susan H
Bought by
Moreau Steven
Home Financials for this Owner
Home Financials are based on the most recent Mortgage that was taken out on this home.
Original Mortgage
$119,850
Interest Rate
6.94%
Mortgage Type
Purchase Money Mortgage
Purchase Details
Closed on
Aug 23, 1996
Sold by
Klepacki Brenda M and Klepacki Mark M
Bought by
Nissen Jonthan S and Nissen Karen A
Purchase Details
Closed on
Jun 15, 1994
Sold by
Lucey Christine N
Bought by
Viamari Joseph P and Viamari Susan H
Create a Home Valuation Report for This Property
The Home Valuation Report is an in-depth analysis detailing your home's value as well as a comparison with similar homes in the area
Home Values in the Area
Average Home Value in this Area
Purchase History
| Date | Buyer | Sale Price | Title Company |
|---|---|---|---|
| Laduc Linda M | $152,500 | -- | |
| Moreau Steven | $117,500 | -- | |
| Nissen Jonthan S | $128,250 | -- | |
| Viamari Joseph P | $97,500 | -- |
Source: Public Records
Mortgage History
| Date | Status | Borrower | Loan Amount |
|---|---|---|---|
| Open | Viamari Joseph P | $116,783 | |
| Closed | Viamari Joseph P | $144,875 | |
| Previous Owner | Viamari Joseph P | $119,850 |
Source: Public Records
Tax History
| Year | Tax Paid | Tax Assessment Tax Assessment Total Assessment is a certain percentage of the fair market value that is determined by local assessors to be the total taxable value of land and additions on the property. | Land | Improvement |
|---|---|---|---|---|
| 2025 | $4,474 | $327,300 | $120,700 | $206,600 |
| 2024 | $4,319 | $318,500 | $117,200 | $201,300 |
| 2023 | $3,390 | $231,400 | $92,200 | $139,200 |
| 2022 | $3,825 | $231,400 | $92,200 | $139,200 |
| 2021 | $4,183 | $238,500 | $92,200 | $146,300 |
| 2020 | $4,110 | $231,400 | $92,200 | $139,200 |
| 2019 | $3,426 | $221,600 | $92,200 | $129,400 |
| 2018 | $3,282 | $205,100 | $86,900 | $118,200 |
| 2017 | $3,200 | $197,400 | $83,500 | $113,900 |
| 2016 | $3,077 | $197,400 | $83,500 | $113,900 |
| 2015 | $2,991 | $197,400 | $83,500 | $113,900 |
Source: Public Records
Map
Nearby Homes
Your Personal Tour Guide
Ask me questions while you tour the home.