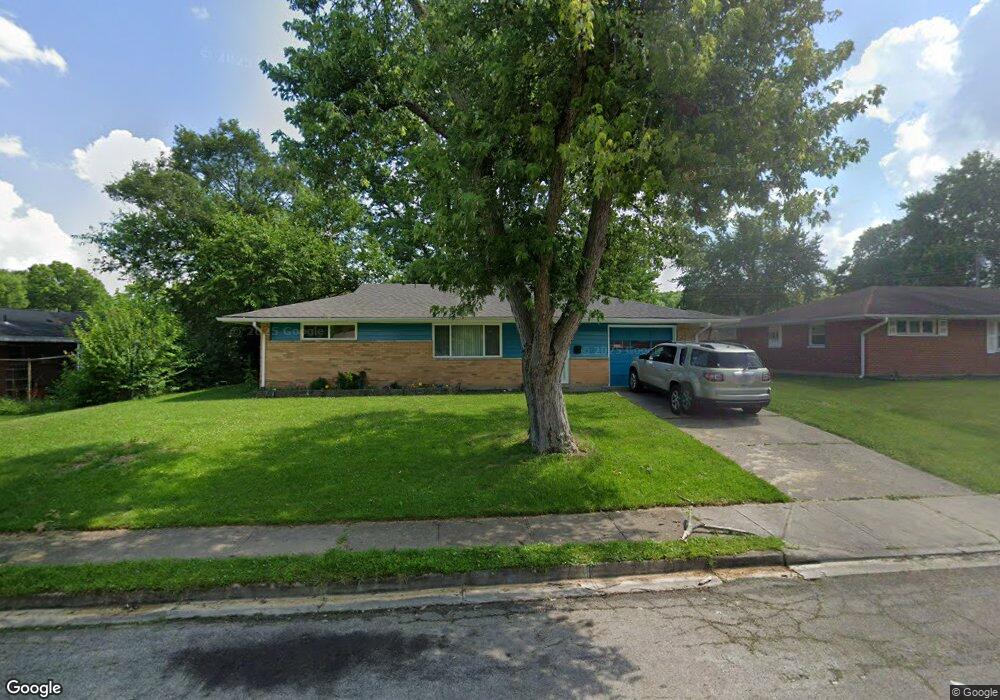
4 Lareta St Dayton, OH 45426
Estimated Value: $121,000 - $150,000
3
Beds
1
Bath
1,181
Sq Ft
$113/Sq Ft
Est. Value
About This Home
This home is located at 4 Lareta St, Dayton, OH 45426 and is currently estimated at $133,265, approximately $112 per square foot. 4 Lareta St is a home located in Montgomery County with nearby schools including Trotwood-Madison Middle School, Trotwood-Madison High School, and Trotwood Preparatory & Fitness Academy.
Ownership History
Date
Name
Owned For
Owner Type
Purchase Details
Closed on
Dec 10, 2020
Sold by
Ferrar Lora J
Bought by
James Brian L and James Tisha K
Current Estimated Value
Home Financials for this Owner
Home Financials are based on the most recent Mortgage that was taken out on this home.
Original Mortgage
$86,406
Outstanding Balance
$76,394
Interest Rate
2.7%
Mortgage Type
FHA
Estimated Equity
$56,871
Purchase Details
Closed on
Jan 15, 2004
Sold by
Stewart Vicki L and Stewart William J
Bought by
Ferrar Lora J
Home Financials for this Owner
Home Financials are based on the most recent Mortgage that was taken out on this home.
Original Mortgage
$47,600
Interest Rate
5.91%
Mortgage Type
Purchase Money Mortgage
Purchase Details
Closed on
Jul 25, 2002
Sold by
Gilmore Edna L
Bought by
Stewart Vicki L and Morris Lisa R
Create a Home Valuation Report for This Property
The Home Valuation Report is an in-depth analysis detailing your home's value as well as a comparison with similar homes in the area
Home Values in the Area
Average Home Value in this Area
Purchase History
| Date | Buyer | Sale Price | Title Company |
|---|---|---|---|
| James Brian L | $88,000 | Home Services Title Llc | |
| Ferrar Lora J | $59,500 | -- | |
| Stewart Vicki L | -- | -- |
Source: Public Records
Mortgage History
| Date | Status | Borrower | Loan Amount |
|---|---|---|---|
| Open | James Brian L | $86,406 | |
| Previous Owner | Ferrar Lora J | $47,600 |
Source: Public Records
Tax History
| Year | Tax Paid | Tax Assessment Tax Assessment Total Assessment is a certain percentage of the fair market value that is determined by local assessors to be the total taxable value of land and additions on the property. | Land | Improvement |
|---|---|---|---|---|
| 2025 | $1,332 | $19,890 | $4,480 | $15,410 |
| 2024 | $1,301 | $19,890 | $4,480 | $15,410 |
| 2023 | $1,301 | $19,890 | $4,480 | $15,410 |
| 2022 | $1,307 | $15,560 | $3,500 | $12,060 |
| 2021 | $1,310 | $15,560 | $3,500 | $12,060 |
| 2020 | $1,340 | $15,560 | $3,500 | $12,060 |
| 2019 | $1,271 | $13,180 | $2,450 | $10,730 |
| 2018 | $1,272 | $13,180 | $2,450 | $10,730 |
| 2017 | $1,265 | $13,180 | $2,450 | $10,730 |
| 2016 | $1,273 | $13,620 | $3,500 | $10,120 |
| 2015 | $1,252 | $13,620 | $3,500 | $10,120 |
| 2014 | $1,252 | $13,620 | $3,500 | $10,120 |
| 2012 | -- | $20,750 | $5,430 | $15,320 |
Source: Public Records
Map
Nearby Homes
- 16 Hillgard St
- 118 Stubbs Dr
- 63 Soloman St
- 98 Gump Place
- 20 Macgregor Dr
- 708 Burman Ave
- 4 Pleasant Ave
- 623 Macmillan Dr
- 417 Vaniman Ave
- 211 E Sunrise Ave
- 30 Sunnybrook Ct
- 709 N Eppington Dr
- 6413 Post Town Rd
- 103 Oak St
- 0 Trotwood Blvd Unit 952242
- 6765 Little Richmond Rd
- 0 Little Richmond Rd
- 512 N Sherry Dr
- 7540 Tuscola Dr
- 4051 Belmore Trace
Your Personal Tour Guide
Ask me questions while you tour the home.