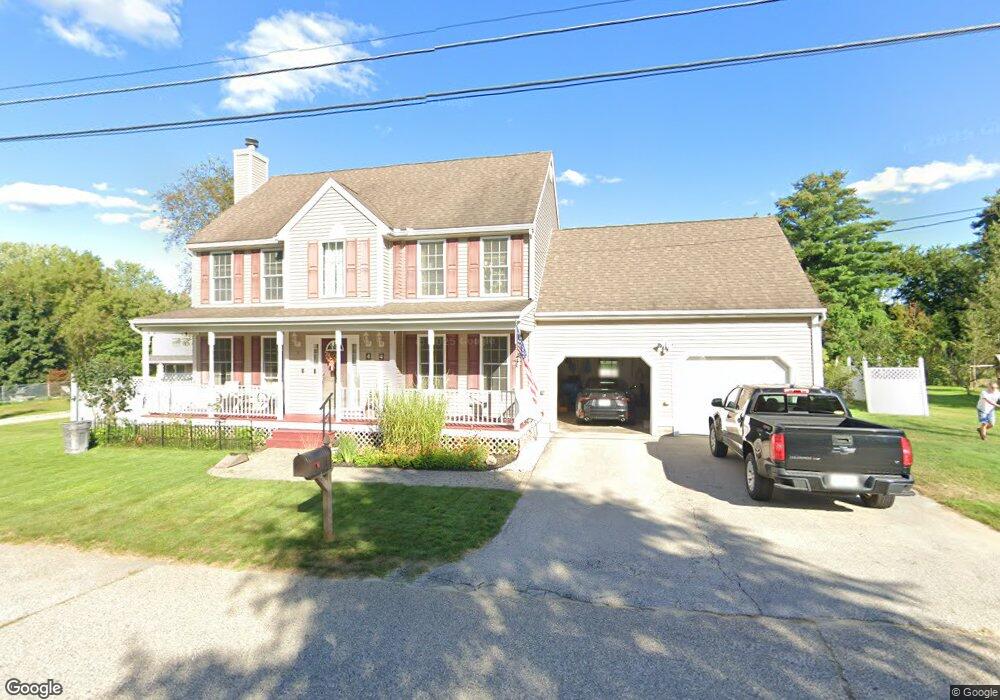
4 Letendre Ave Allenstown, NH 03275
Suncook NeighborhoodEstimated Value: $520,000 - $600,561
3
Beds
3
Baths
2,441
Sq Ft
$227/Sq Ft
Est. Value
About This Home
This home is located at 4 Letendre Ave, Allenstown, NH 03275 and is currently estimated at $552,890, approximately $226 per square foot. 4 Letendre Ave is a home located in Merrimack County with nearby schools including Allenstown Elementary School, Armand R. Dupont School, and Tender Years Child Care & Learning Center.
Ownership History
Date
Name
Owned For
Owner Type
Purchase Details
Closed on
Jul 18, 2006
Sold by
Hill Dwight R and Hill Dawn M
Bought by
Emerson Neil R and Emerson Linda M
Current Estimated Value
Home Financials for this Owner
Home Financials are based on the most recent Mortgage that was taken out on this home.
Original Mortgage
$261,000
Interest Rate
6.71%
Create a Home Valuation Report for This Property
The Home Valuation Report is an in-depth analysis detailing your home's value as well as a comparison with similar homes in the area
Home Values in the Area
Average Home Value in this Area
Purchase History
| Date | Buyer | Sale Price | Title Company |
|---|---|---|---|
| Emerson Neil R | $290,000 | -- | |
| Emerson Neil R | $290,000 | -- |
Source: Public Records
Mortgage History
| Date | Status | Borrower | Loan Amount |
|---|---|---|---|
| Open | Emerson Neil R | $148,016 | |
| Open | Emerson Neil R | $259,293 | |
| Closed | Emerson Neil R | $261,000 |
Source: Public Records
Tax History Compared to Growth
Tax History
| Year | Tax Paid | Tax Assessment Tax Assessment Total Assessment is a certain percentage of the fair market value that is determined by local assessors to be the total taxable value of land and additions on the property. | Land | Improvement |
|---|---|---|---|---|
| 2024 | $12,095 | $475,800 | $145,200 | $330,600 |
| 2023 | $10,087 | $475,800 | $145,200 | $330,600 |
| 2022 | $9,278 | $475,800 | $145,200 | $330,600 |
| 2021 | $8,814 | $279,800 | $82,500 | $197,300 |
| 2020 | $8,125 | $277,300 | $82,500 | $194,800 |
| 2019 | $8,624 | $277,300 | $82,500 | $194,800 |
| 2018 | $8,361 | $277,300 | $82,500 | $194,800 |
| 2017 | $8,904 | $277,300 | $82,500 | $194,800 |
| 2016 | $8,187 | $241,800 | $60,000 | $181,800 |
| 2015 | $7,938 | $241,800 | $60,000 | $181,800 |
| 2014 | $7,438 | $220,200 | $60,000 | $160,200 |
| 2013 | $6,943 | $220,200 | $60,000 | $160,200 |
Source: Public Records
Map
Nearby Homes
- 422 Dawn Dr Unit 23
- 427 Dawn Dr Unit 15
- 1 1/2 Bartlett St
- 111 Glass St
- 19 Sullivan Dr
- 12-14 Church St Unit 12,14
- 100 Main St Unit M10
- 100 Main St Unit 204
- 15 Main St
- 4 Rodger Rd
- 7 Ferry St
- 10 Lane Dr
- 2 Cheryl Dr
- 15 Sullivan Dr
- 307 Dearborn Rd
- 233 Pembroke St
- 259 Pembroke St
- 1821 Hooksett Rd
- 10 Winchester Ct
- 9 Pine Acres Rd