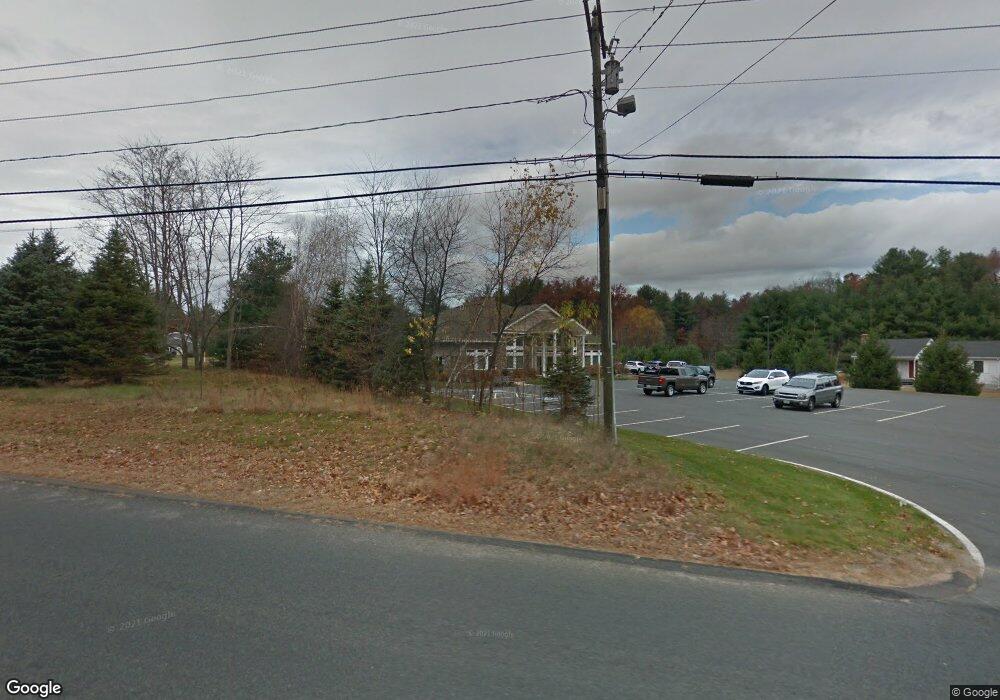
4 Line St Southampton, MA 01073
Estimated Value: $1,345,692
--
Bed
--
Bath
5,200
Sq Ft
$259/Sq Ft
Est. Value
About This Home
This home is located at 4 Line St, Southampton, MA 01073 and is currently estimated at $1,345,692, approximately $258 per square foot. 4 Line St is a home located in Hampshire County with nearby schools including William E Norris School, Hilltown Cooperative Charter Public School, and Calvary Baptist Christian School.
Ownership History
Date
Name
Owned For
Owner Type
Purchase Details
Closed on
May 19, 2016
Sold by
Dutch Llc
Bought by
Merellie Realty Llc
Current Estimated Value
Home Financials for this Owner
Home Financials are based on the most recent Mortgage that was taken out on this home.
Original Mortgage
$578,000
Outstanding Balance
$459,076
Interest Rate
3.59%
Mortgage Type
Commercial
Estimated Equity
$895,215
Purchase Details
Closed on
Sep 27, 2004
Sold by
Cullington Jeffrey W
Bought by
Dutch Llc
Purchase Details
Closed on
Jan 15, 2003
Sold by
Liebmann Janna and Liebmann Roland M
Bought by
Cullington Jeffrey W
Home Financials for this Owner
Home Financials are based on the most recent Mortgage that was taken out on this home.
Original Mortgage
$148,000
Interest Rate
6.18%
Mortgage Type
Commercial
Create a Home Valuation Report for This Property
The Home Valuation Report is an in-depth analysis detailing your home's value as well as a comparison with similar homes in the area
Home Values in the Area
Average Home Value in this Area
Purchase History
| Date | Buyer | Sale Price | Title Company |
|---|---|---|---|
| Merellie Realty Llc | $722,500 | -- | |
| Dutch Llc | -- | -- | |
| Cullington Jeffrey W | $180,000 | -- |
Source: Public Records
Mortgage History
| Date | Status | Borrower | Loan Amount |
|---|---|---|---|
| Open | Merellie Realty Llc | $578,000 | |
| Previous Owner | Cullington Jeffrey W | $148,000 |
Source: Public Records
Tax History Compared to Growth
Tax History
| Year | Tax Paid | Tax Assessment Tax Assessment Total Assessment is a certain percentage of the fair market value that is determined by local assessors to be the total taxable value of land and additions on the property. | Land | Improvement |
|---|---|---|---|---|
| 2025 | $9,318 | $657,600 | $118,000 | $539,600 |
| 2024 | $8,604 | $603,800 | $118,000 | $485,800 |
| 2023 | $8,652 | $603,800 | $118,000 | $485,800 |
| 2022 | $8,397 | $557,200 | $71,400 | $485,800 |
| 2021 | $8,898 | $557,200 | $71,400 | $485,800 |
| 2020 | $8,815 | $557,200 | $71,400 | $485,800 |
| 2019 | $8,449 | $518,000 | $71,400 | $446,600 |
| 2018 | $7,992 | $478,000 | $64,000 | $414,000 |
| 2017 | $7,801 | $478,000 | $64,000 | $414,000 |
| 2015 | $5,957 | $379,200 | $50,000 | $329,200 |
Source: Public Records
Map
Nearby Homes