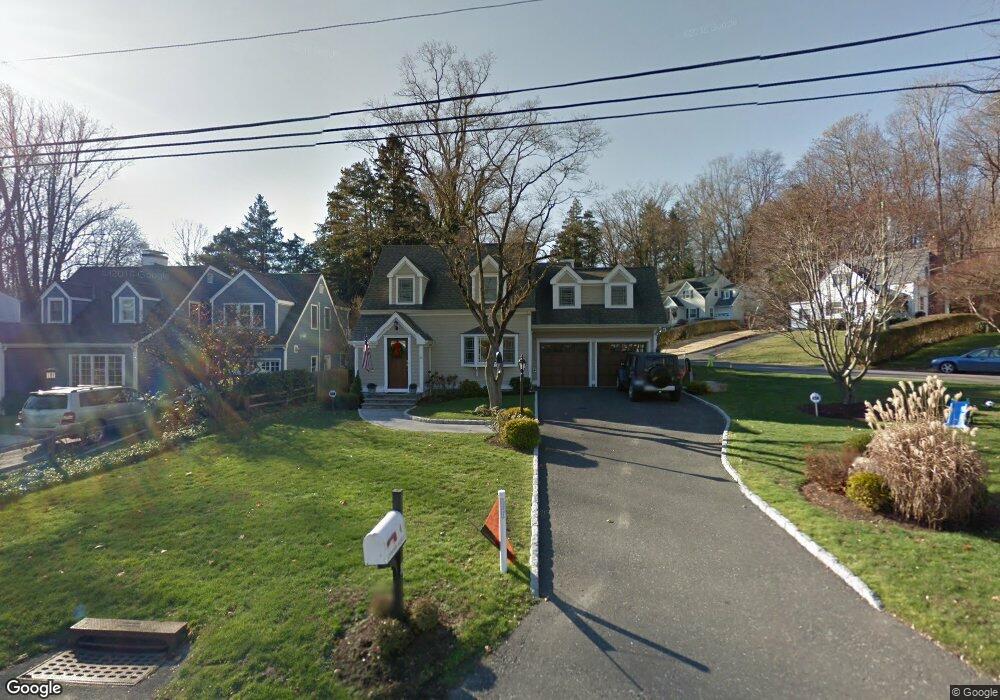
4 Linwood Ave Riverside, CT 06878
Estimated Value: $1,784,000 - $3,136,000
3
Beds
3
Baths
2,588
Sq Ft
$907/Sq Ft
Est. Value
About This Home
This home is located at 4 Linwood Ave, Riverside, CT 06878 and is currently estimated at $2,347,711, approximately $907 per square foot. 4 Linwood Ave is a home located in Fairfield County with nearby schools including International School At Dundee, Eastern Middle School, and Greenwich High School.
Ownership History
Date
Name
Owned For
Owner Type
Purchase Details
Closed on
Aug 16, 2013
Sold by
Mccue Suzanne A
Bought by
Cmccue Dandrea R and Mccue Kristine L
Current Estimated Value
Purchase Details
Closed on
Jan 3, 2007
Sold by
Pratt Jennifer M
Bought by
Mccue Suzanne A
Home Financials for this Owner
Home Financials are based on the most recent Mortgage that was taken out on this home.
Original Mortgage
$300,000
Interest Rate
6.24%
Purchase Details
Closed on
Feb 25, 2000
Sold by
Rosnyai Denise J
Bought by
Pratt Jennifer M
Home Financials for this Owner
Home Financials are based on the most recent Mortgage that was taken out on this home.
Original Mortgage
$230,000
Interest Rate
8.15%
Purchase Details
Closed on
Feb 20, 1998
Sold by
Newton Henrietta Est
Bought by
Rosnyai Denise J
Create a Home Valuation Report for This Property
The Home Valuation Report is an in-depth analysis detailing your home's value as well as a comparison with similar homes in the area
Home Values in the Area
Average Home Value in this Area
Purchase History
| Date | Buyer | Sale Price | Title Company |
|---|---|---|---|
| Cmccue Dandrea R | -- | -- | |
| Mccue Suzanne A | $300,000 | -- | |
| Pratt Jennifer M | $500,000 | -- | |
| Rosnyai Denise J | $369,000 | -- |
Source: Public Records
Mortgage History
| Date | Status | Borrower | Loan Amount |
|---|---|---|---|
| Previous Owner | Rosnyai Denise J | $300,000 | |
| Previous Owner | Rosnyai Denise J | $224,000 | |
| Previous Owner | Rosnyai Denise J | $230,000 | |
| Previous Owner | Rosnyai Denise J | $337,500 |
Source: Public Records
Tax History Compared to Growth
Tax History
| Year | Tax Paid | Tax Assessment Tax Assessment Total Assessment is a certain percentage of the fair market value that is determined by local assessors to be the total taxable value of land and additions on the property. | Land | Improvement |
|---|---|---|---|---|
| 2025 | $11,938 | $965,930 | $574,350 | $391,580 |
| 2024 | $11,529 | $965,930 | $574,350 | $391,580 |
| 2023 | $11,240 | $965,930 | $574,350 | $391,580 |
| 2022 | $11,137 | $965,930 | $574,350 | $391,580 |
| 2021 | $11,638 | $966,630 | $561,330 | $405,300 |
| 2020 | $11,619 | $966,630 | $561,330 | $405,300 |
| 2019 | $11,735 | $966,630 | $561,330 | $405,300 |
| 2018 | $11,474 | $966,630 | $561,330 | $405,300 |
| 2017 | $11,566 | $962,290 | $561,330 | $400,960 |
| 2016 | $9,397 | $794,430 | $561,330 | $233,100 |
| 2015 | $7,282 | $610,610 | $546,560 | $64,050 |
| 2014 | $7,098 | $610,610 | $546,560 | $64,050 |
Source: Public Records
Map
Nearby Homes
- 27 Sound Beach Ave
- 18 Sound Beach Ave
- 143 Lockwood Rd
- 20 Center Dr
- 25 Dialstone Ln
- 25 Hoover Rd
- 6 Dorchester Ln
- 23 Silver Beech Rd
- 11 Perna Ln
- 1465 E Putnam Ave Unit 525
- 45 Sunshine Ave
- 48 Meyer Place
- 119 Hendrie Ave
- 32 Meyer Place
- 3 Finney Knoll Ln
- 51 Forest Ave Unit 98
- 51 Forest Ave Unit 82
- 22 Summit Rd
- 33 Halsey Dr
- 7 Highview Ave