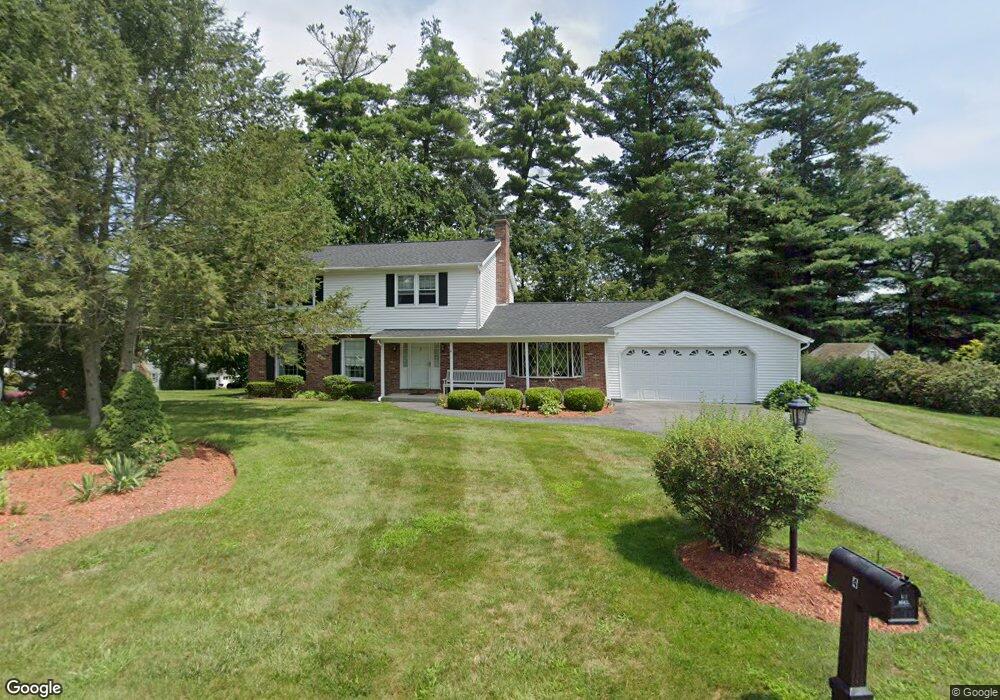
4 Longwood Rd Salem, NH 03079
Depot Village NeighborhoodEstimated Value: $630,000 - $709,000
4
Beds
3
Baths
2,120
Sq Ft
$310/Sq Ft
Est. Value
About This Home
This home is located at 4 Longwood Rd, Salem, NH 03079 and is currently estimated at $657,776, approximately $310 per square foot. 4 Longwood Rd is a home located in Rockingham County with nearby schools including Mary A. Fisk Elementary School, Woodbury School, and Salem High School.
Ownership History
Date
Name
Owned For
Owner Type
Purchase Details
Closed on
Apr 6, 1999
Sold by
Haley Irene M and Haley Thomas A
Bought by
Baroffio Antonio E
Current Estimated Value
Home Financials for this Owner
Home Financials are based on the most recent Mortgage that was taken out on this home.
Original Mortgage
$100,000
Outstanding Balance
$24,775
Interest Rate
6.78%
Mortgage Type
Purchase Money Mortgage
Estimated Equity
$633,001
Create a Home Valuation Report for This Property
The Home Valuation Report is an in-depth analysis detailing your home's value as well as a comparison with similar homes in the area
Home Values in the Area
Average Home Value in this Area
Purchase History
| Date | Buyer | Sale Price | Title Company |
|---|---|---|---|
| Baroffio Antonio E | $196,000 | -- |
Source: Public Records
Mortgage History
| Date | Status | Borrower | Loan Amount |
|---|---|---|---|
| Open | Baroffio Antonio E | $100,000 |
Source: Public Records
Tax History Compared to Growth
Tax History
| Year | Tax Paid | Tax Assessment Tax Assessment Total Assessment is a certain percentage of the fair market value that is determined by local assessors to be the total taxable value of land and additions on the property. | Land | Improvement |
|---|---|---|---|---|
| 2024 | $8,073 | $458,700 | $170,800 | $287,900 |
| 2023 | $7,780 | $458,700 | $170,800 | $287,900 |
| 2022 | $7,362 | $458,700 | $170,800 | $287,900 |
| 2021 | $7,330 | $458,700 | $170,800 | $287,900 |
| 2020 | $7,687 | $349,100 | $121,900 | $227,200 |
| 2019 | $7,673 | $349,100 | $121,900 | $227,200 |
| 2018 | $7,544 | $349,100 | $121,900 | $227,200 |
| 2017 | $7,275 | $349,100 | $121,900 | $227,200 |
| 2016 | $7,132 | $349,100 | $121,900 | $227,200 |
| 2015 | $6,545 | $306,000 | $124,000 | $182,000 |
| 2014 | $6,362 | $306,000 | $124,000 | $182,000 |
| 2013 | $6,261 | $306,000 | $124,000 | $182,000 |
Source: Public Records
Map
Nearby Homes