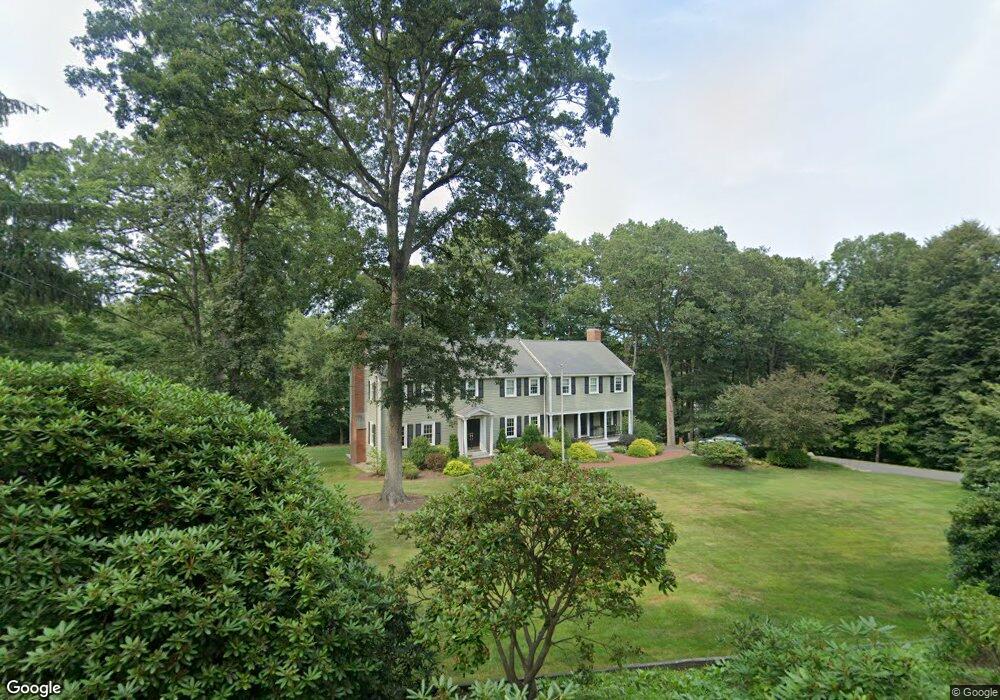
4 Main Dr Wenham, MA 01984
Estimated Value: $1,264,652 - $1,350,000
5
Beds
3
Baths
3,256
Sq Ft
$407/Sq Ft
Est. Value
About This Home
This home is located at 4 Main Dr, Wenham, MA 01984 and is currently estimated at $1,325,663, approximately $407 per square foot. 4 Main Dr is a home located in Essex County with nearby schools including Winthrop School, Bessie Buker Elementary School, and Cutler Elementary School.
Ownership History
Date
Name
Owned For
Owner Type
Purchase Details
Closed on
Jul 28, 2017
Sold by
Romano James and Romano Jill
Bought by
James E Romano Ret
Current Estimated Value
Purchase Details
Closed on
Oct 24, 2007
Sold by
Cendant Mobilit Fncl C
Bought by
Romano James and Romano Jill
Purchase Details
Closed on
Apr 14, 2006
Sold by
Brayton Andrew P and Brayton Kelly
Bought by
Cendant Mobilit Fncl C
Purchase Details
Closed on
Jan 28, 2000
Sold by
Macleod John N and Macleod Virginia M
Bought by
Brayton Andrew P and Brayton Kelly
Create a Home Valuation Report for This Property
The Home Valuation Report is an in-depth analysis detailing your home's value as well as a comparison with similar homes in the area
Home Values in the Area
Average Home Value in this Area
Purchase History
We collect this data history from publicly available records. To have your information removed, we recommend requesting removal directly through your county’s website.
| Date | Buyer | Sale Price | Title Company |
|---|---|---|---|
| James E Romano Ret | -- | -- | |
| Romano James | $640,000 | -- | |
| Cendant Mobilit Fncl C | -- | -- | |
| Cendant Mobilit Fncl C | $807,500 | -- | |
| Brayton Andrew P | $495,000 | -- |
Source: Public Records
Mortgage History
We collect this data history from publicly available records. To have your information removed, we recommend requesting removal directly through your county’s website.
| Date | Status | Borrower | Loan Amount |
|---|---|---|---|
| Previous Owner | Brayton Andrew P | $190,000 | |
| Previous Owner | Brayton Andrew P | $198,000 |
Source: Public Records
Tax History
| Year | Tax Paid | Tax Assessment Tax Assessment Total Assessment is a certain percentage of the fair market value that is determined by local assessors to be the total taxable value of land and additions on the property. | Land | Improvement |
|---|---|---|---|---|
| 2025 | $16,171 | $1,040,600 | $496,200 | $544,400 |
| 2024 | $15,803 | $1,009,100 | $496,200 | $512,900 |
| 2023 | $14,255 | $821,600 | $544,800 | $276,800 |
| 2022 | $13,784 | $704,000 | $421,100 | $282,900 |
| 2021 | $13,243 | $672,900 | $390,000 | $282,900 |
| 2020 | $12,256 | $647,100 | $390,100 | $257,000 |
| 2019 | $11,661 | $647,100 | $390,100 | $257,000 |
| 2018 | $11,107 | $591,100 | $377,600 | $213,500 |
| 2017 | $10,835 | $591,100 | $377,600 | $213,500 |
| 2016 | $10,037 | $591,100 | $377,600 | $213,500 |
| 2015 | $9,605 | $591,100 | $377,600 | $213,500 |
Source: Public Records
Map
Nearby Homes
Your Personal Tour Guide
Ask me questions while you tour the home.