Estimated Value: $1,277,000 - $1,836,000
4
Beds
3
Baths
3,744
Sq Ft
$434/Sq Ft
Est. Value
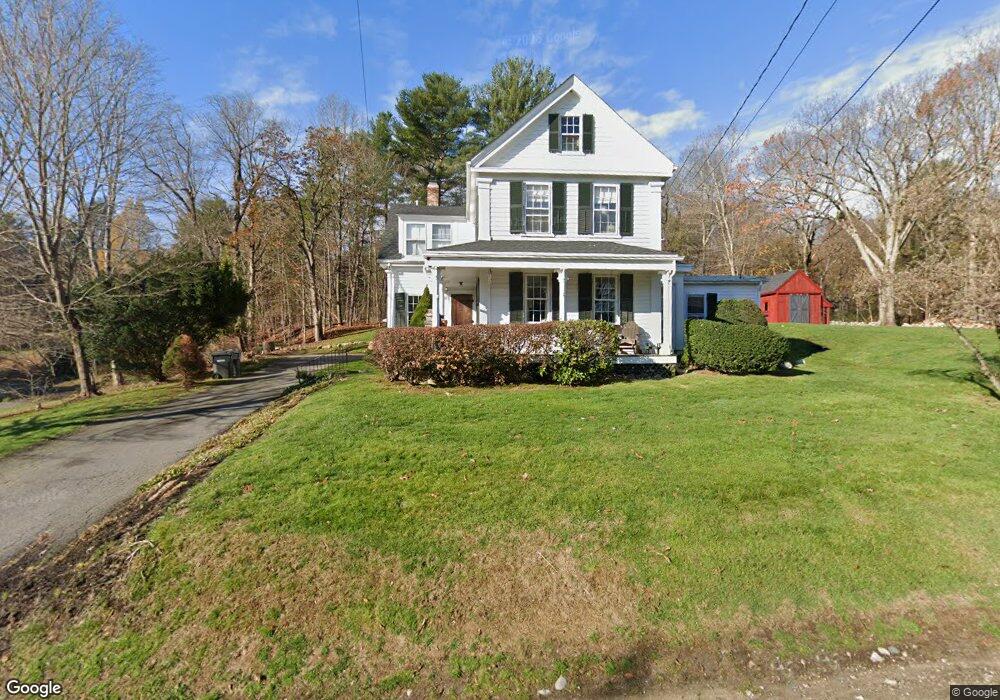
About This Home
This home is located at 4 Main St, Dover, MA 02030 and is currently estimated at $1,624,547, approximately $433 per square foot. 4 Main St is a home located in Norfolk County with nearby schools including Chickering Elementary School, Dover-Sherborn Regional Middle School, and Dover-Sherborn Regional High School.
Ownership History
Date
Name
Owned For
Owner Type
Purchase Details
Closed on
Feb 6, 2026
Sold by
Haven Development Llc
Bought by
Diamond Wesley R and Diamond Sarah J
Current Estimated Value
Home Financials for this Owner
Home Financials are based on the most recent Mortgage that was taken out on this home.
Original Mortgage
$1,440,000
Outstanding Balance
$1,440,000
Interest Rate
6.18%
Mortgage Type
New Conventional
Estimated Equity
$184,547
Purchase Details
Closed on
Apr 1, 2024
Sold by
Nolen Anne K
Bought by
Haven Development Llc
Home Financials for this Owner
Home Financials are based on the most recent Mortgage that was taken out on this home.
Original Mortgage
$1,350,000
Interest Rate
6.77%
Mortgage Type
Purchase Money Mortgage
Purchase Details
Closed on
Jun 8, 2022
Sold by
Nolen Bruce D
Bought by
Nolen Anne K
Home Financials for this Owner
Home Financials are based on the most recent Mortgage that was taken out on this home.
Original Mortgage
$775,000
Interest Rate
3.88%
Mortgage Type
Adjustable Rate Mortgage/ARM
Purchase Details
Closed on
Jul 2, 2002
Sold by
Bengston Bruce R and Bengston Leslie W
Bought by
Nolen Bruce D and Nolen Anne K
Home Financials for this Owner
Home Financials are based on the most recent Mortgage that was taken out on this home.
Original Mortgage
$521,600
Interest Rate
6.92%
Mortgage Type
Purchase Money Mortgage
Create a Home Valuation Report for This Property
The Home Valuation Report is an in-depth analysis detailing your home's value as well as a comparison with similar homes in the area
Home Values in the Area
Average Home Value in this Area
Purchase History
| Date | Buyer | Sale Price | Title Company |
|---|---|---|---|
| Diamond Wesley R | -- | -- | |
| Haven Development Llc | $1,650,000 | None Available | |
| Nolen Anne K | -- | None Available | |
| Nolen Anne K | -- | None Available | |
| Nolen Bruce D | $652,000 | -- | |
| Nolen Bruce D | $652,000 | -- |
Source: Public Records
Mortgage History
| Date | Status | Borrower | Loan Amount |
|---|---|---|---|
| Open | Diamond Wesley R | $1,440,000 | |
| Previous Owner | Haven Development Llc | $1,350,000 | |
| Previous Owner | Nolen Anne K | $775,000 | |
| Previous Owner | Nolen Bruce D | $45,000 | |
| Previous Owner | Nolen Bruce D | $521,600 |
Source: Public Records
Tax History
| Year | Tax Paid | Tax Assessment Tax Assessment Total Assessment is a certain percentage of the fair market value that is determined by local assessors to be the total taxable value of land and additions on the property. | Land | Improvement |
|---|---|---|---|---|
| 2025 | $15,973 | $1,417,300 | $680,800 | $736,500 |
| 2024 | $15,349 | $1,400,500 | $680,800 | $719,700 |
| 2023 | $13,073 | $1,072,400 | $537,700 | $534,700 |
| 2022 | $13,185 | $1,061,600 | $537,700 | $523,900 |
| 2021 | $13,754 | $1,067,000 | $537,700 | $529,300 |
| 2020 | $13,422 | $1,045,300 | $537,700 | $507,600 |
| 2019 | $13,516 | $1,045,300 | $537,700 | $507,600 |
| 2018 | $11,819 | $920,500 | $441,900 | $478,600 |
| 2017 | $12,195 | $934,500 | $428,800 | $505,700 |
| 2016 | $12,734 | $988,700 | $428,800 | $559,900 |
| 2015 | $11,731 | $923,700 | $428,800 | $494,900 |
Source: Public Records
Map
Nearby Homes
Your Personal Tour Guide
Ask me questions while you tour the home.