Estimated Value: $1,707,000 - $1,873,000
4
Beds
4
Baths
4,464
Sq Ft
$396/Sq Ft
Est. Value
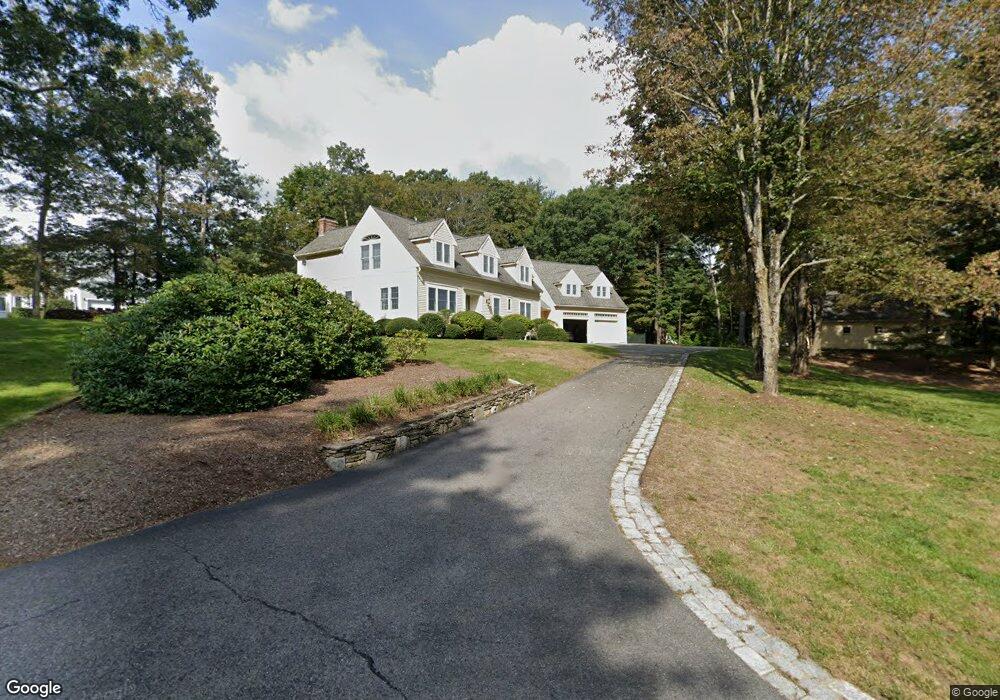
About This Home
This home is located at 4 Maple Ln, Dover, MA 02030 and is currently estimated at $1,769,548, approximately $396 per square foot. 4 Maple Ln is a home located in Norfolk County with nearby schools including Chickering Elementary School, Dover-Sherborn Regional Middle School, and Dover-Sherborn Regional High School.
Ownership History
Date
Name
Owned For
Owner Type
Purchase Details
Closed on
Jan 10, 2013
Sold by
Demarco Joseph and Demarco Elisabeth
Bought by
4 Maple Lane Rt
Current Estimated Value
Purchase Details
Closed on
Aug 27, 2012
Sold by
4 Maple Lane Rt and Demarco Joseph
Bought by
Demarco Joseph and Demarco Elisabeth
Home Financials for this Owner
Home Financials are based on the most recent Mortgage that was taken out on this home.
Original Mortgage
$350,000
Interest Rate
3.61%
Mortgage Type
New Conventional
Purchase Details
Closed on
Jul 23, 2012
Sold by
Demarco Joseph A and Demarco Elisabeth R
Bought by
4 Maple Lane Rt and Demarco Joseph A
Home Financials for this Owner
Home Financials are based on the most recent Mortgage that was taken out on this home.
Original Mortgage
$350,000
Interest Rate
3.61%
Mortgage Type
New Conventional
Purchase Details
Closed on
Nov 13, 1996
Sold by
Levy Tr Franklin
Bought by
Demarco Joseph A and Demarco Elisabeth R
Create a Home Valuation Report for This Property
The Home Valuation Report is an in-depth analysis detailing your home's value as well as a comparison with similar homes in the area
Home Values in the Area
Average Home Value in this Area
Purchase History
| Date | Buyer | Sale Price | Title Company |
|---|---|---|---|
| 4 Maple Lane Rt | -- | -- | |
| Demarco Joseph | -- | -- | |
| 4 Maple Lane Rt | -- | -- | |
| Demarco Joseph A | $325,000 | -- |
Source: Public Records
Mortgage History
| Date | Status | Borrower | Loan Amount |
|---|---|---|---|
| Previous Owner | Demarco Joseph | $350,000 | |
| Previous Owner | Demarco Joseph A | $60,757 | |
| Previous Owner | Demarco Joseph A | $185,000 |
Source: Public Records
Tax History
| Year | Tax Paid | Tax Assessment Tax Assessment Total Assessment is a certain percentage of the fair market value that is determined by local assessors to be the total taxable value of land and additions on the property. | Land | Improvement |
|---|---|---|---|---|
| 2025 | $15,421 | $1,368,300 | $647,000 | $721,300 |
| 2024 | $14,639 | $1,335,700 | $625,200 | $710,500 |
| 2023 | $14,162 | $1,161,800 | $548,600 | $613,200 |
| 2022 | $13,142 | $1,058,100 | $526,800 | $531,300 |
| 2021 | $13,639 | $1,058,100 | $526,800 | $531,300 |
| 2020 | $13,586 | $1,058,100 | $526,800 | $531,300 |
| 2019 | $13,681 | $1,058,100 | $526,800 | $531,300 |
| 2018 | $13,170 | $1,025,700 | $526,800 | $498,900 |
| 2017 | $12,818 | $982,200 | $483,300 | $498,900 |
| 2016 | $12,782 | $992,400 | $483,300 | $509,100 |
| 2015 | $12,299 | $968,400 | $459,300 | $509,100 |
Source: Public Records
Map
Nearby Homes
Your Personal Tour Guide
Ask me questions while you tour the home.