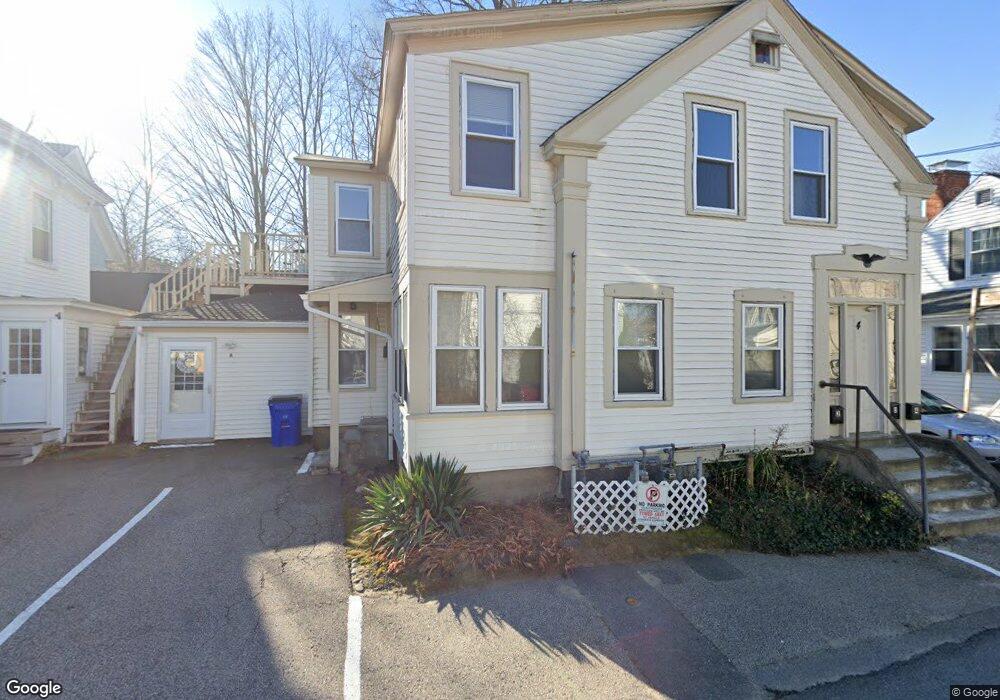
4 Maple St Exeter, NH 03833
Estimated Value: $536,303 - $648,000
4
Beds
3
Baths
2,135
Sq Ft
$274/Sq Ft
Est. Value
About This Home
This home is located at 4 Maple St, Exeter, NH 03833 and is currently estimated at $585,326, approximately $274 per square foot. 4 Maple St is a home located in Rockingham County with nearby schools including Main Street School, Lincoln Street Elementary School, and Cooperative Middle School.
Ownership History
Date
Name
Owned For
Owner Type
Purchase Details
Closed on
Sep 8, 2016
Sold by
Jackson N Anthony
Bought by
Jackson Properties Llc
Current Estimated Value
Home Financials for this Owner
Home Financials are based on the most recent Mortgage that was taken out on this home.
Original Mortgage
$179,800
Outstanding Balance
$110,453
Interest Rate
3.48%
Mortgage Type
New Conventional
Estimated Equity
$474,873
Create a Home Valuation Report for This Property
The Home Valuation Report is an in-depth analysis detailing your home's value as well as a comparison with similar homes in the area
Home Values in the Area
Average Home Value in this Area
Purchase History
| Date | Buyer | Sale Price | Title Company |
|---|---|---|---|
| Jackson Properties Llc | $179,800 | -- |
Source: Public Records
Mortgage History
| Date | Status | Borrower | Loan Amount |
|---|---|---|---|
| Open | Jackson Properties Llc | $179,800 |
Source: Public Records
Tax History
| Year | Tax Paid | Tax Assessment Tax Assessment Total Assessment is a certain percentage of the fair market value that is determined by local assessors to be the total taxable value of land and additions on the property. | Land | Improvement |
|---|---|---|---|---|
| 2025 | $8,196 | $436,900 | $166,900 | $270,000 |
| 2024 | $7,772 | $436,900 | $166,900 | $270,000 |
| 2023 | $6,200 | $231,500 | $89,300 | $142,200 |
| 2022 | $5,722 | $231,200 | $89,300 | $141,900 |
| 2021 | $5,551 | $231,200 | $89,300 | $141,900 |
| 2020 | $5,662 | $231,200 | $89,300 | $141,900 |
| 2019 | $5,380 | $231,200 | $89,300 | $141,900 |
| 2018 | $4,945 | $179,800 | $38,400 | $141,400 |
| 2017 | $4,813 | $179,800 | $38,400 | $141,400 |
| 2016 | $4,718 | $179,800 | $38,400 | $141,400 |
| 2015 | $4,592 | $179,800 | $38,400 | $141,400 |
| 2014 | $4,430 | $170,000 | $38,400 | $131,600 |
| 2013 | $4,425 | $170,000 | $38,400 | $131,600 |
| 2011 | $4,298 | $170,000 | $38,400 | $131,600 |
Source: Public Records
Map
Nearby Homes
- 32 Willey Creek Rd Unit 303
- 163 Water St Unit B2
- 163 Water St Unit A1
- 10 String Bridge
- 15 High St Unit 2
- 196 Water St Unit 18
- 81 Front St Unit 6
- 81 Front St Unit 3
- 81 Front St Unit 5
- 13 Bell Ave
- 51 Portsmouth Ave
- 41 Hayes Mobile Home Park
- 50 Linden St
- 94 Wadleigh St Unit 32
- 24 Wadleigh St Unit 4
- 0 High St Unit 2
- 25 Carroll St
- 105 Portsmouth Ave Unit 9
- 50 Brookside Dr Unit 7
- 50 Brookside Dr Unit F2
Your Personal Tour Guide
Ask me questions while you tour the home.