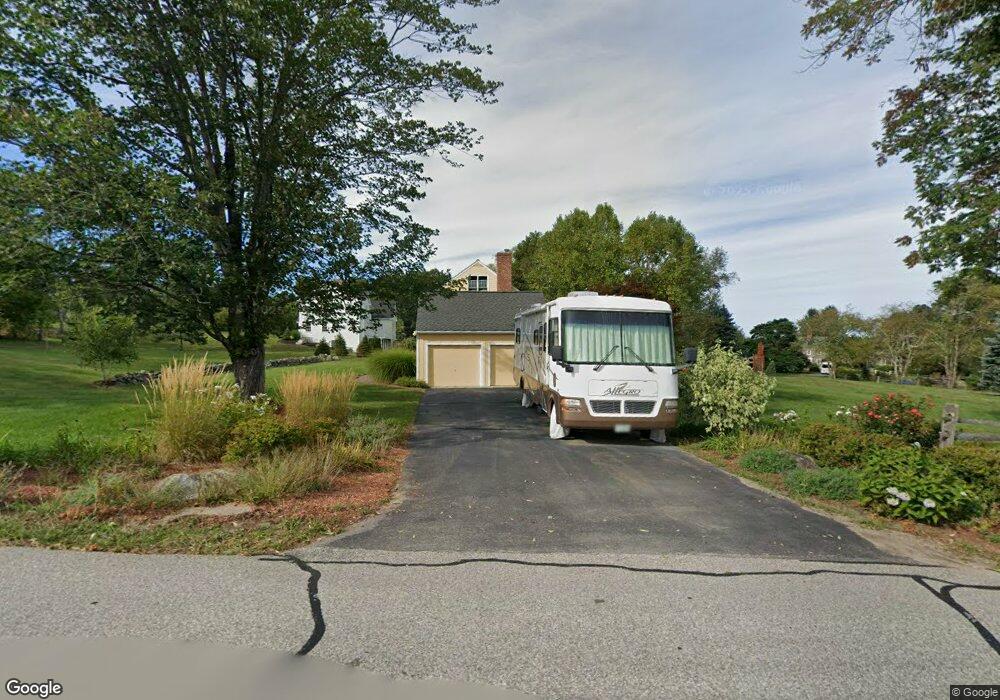
4 Merrill Ln Hollis, NH 03049
Hollis NeighborhoodEstimated Value: $803,676 - $1,021,000
3
Beds
2
Baths
2,479
Sq Ft
$364/Sq Ft
Est. Value
About This Home
This home is located at 4 Merrill Ln, Hollis, NH 03049 and is currently estimated at $901,669, approximately $363 per square foot. 4 Merrill Ln is a home with nearby schools including Hollis Primary School, Hollis Upper Elementary School, and Hollis-Brookline Middle School.
Ownership History
Date
Name
Owned For
Owner Type
Purchase Details
Closed on
Sep 21, 1999
Sold by
Doucsta Carol Sweigard
Bought by
Claire Michael D and Claire Lisa I
Current Estimated Value
Home Financials for this Owner
Home Financials are based on the most recent Mortgage that was taken out on this home.
Original Mortgage
$240,000
Interest Rate
7.83%
Purchase Details
Closed on
Jun 25, 1999
Sold by
Dochsta Carol Sweigard
Bought by
Coulter Barbara J
Create a Home Valuation Report for This Property
The Home Valuation Report is an in-depth analysis detailing your home's value as well as a comparison with similar homes in the area
Home Values in the Area
Average Home Value in this Area
Purchase History
| Date | Buyer | Sale Price | Title Company |
|---|---|---|---|
| Claire Michael D | $108,000 | -- | |
| Coulter Barbara J | $95,000 | -- |
Source: Public Records
Mortgage History
| Date | Status | Borrower | Loan Amount |
|---|---|---|---|
| Open | Coulter Barbara J | $200,000 | |
| Closed | Coulter Barbara J | $240,000 |
Source: Public Records
Tax History Compared to Growth
Tax History
| Year | Tax Paid | Tax Assessment Tax Assessment Total Assessment is a certain percentage of the fair market value that is determined by local assessors to be the total taxable value of land and additions on the property. | Land | Improvement |
|---|---|---|---|---|
| 2024 | $12,558 | $708,300 | $352,600 | $355,700 |
| 2023 | $11,800 | $708,300 | $352,600 | $355,700 |
| 2022 | $15,986 | $708,300 | $352,600 | $355,700 |
| 2021 | $10,081 | $444,100 | $226,600 | $217,500 |
| 2020 | $10,294 | $444,100 | $226,600 | $217,500 |
| 2019 | $0 | $441,900 | $226,600 | $215,300 |
| 2018 | $9,576 | $441,900 | $226,600 | $215,300 |
| 2017 | $8,283 | $357,800 | $155,600 | $202,200 |
| 2016 | $8,215 | $350,600 | $155,600 | $195,000 |
| 2015 | $8,071 | $350,600 | $155,600 | $195,000 |
| 2014 | $8,107 | $350,500 | $155,500 | $195,000 |
| 2013 | $7,998 | $350,500 | $155,500 | $195,000 |
Source: Public Records
Map
Nearby Homes