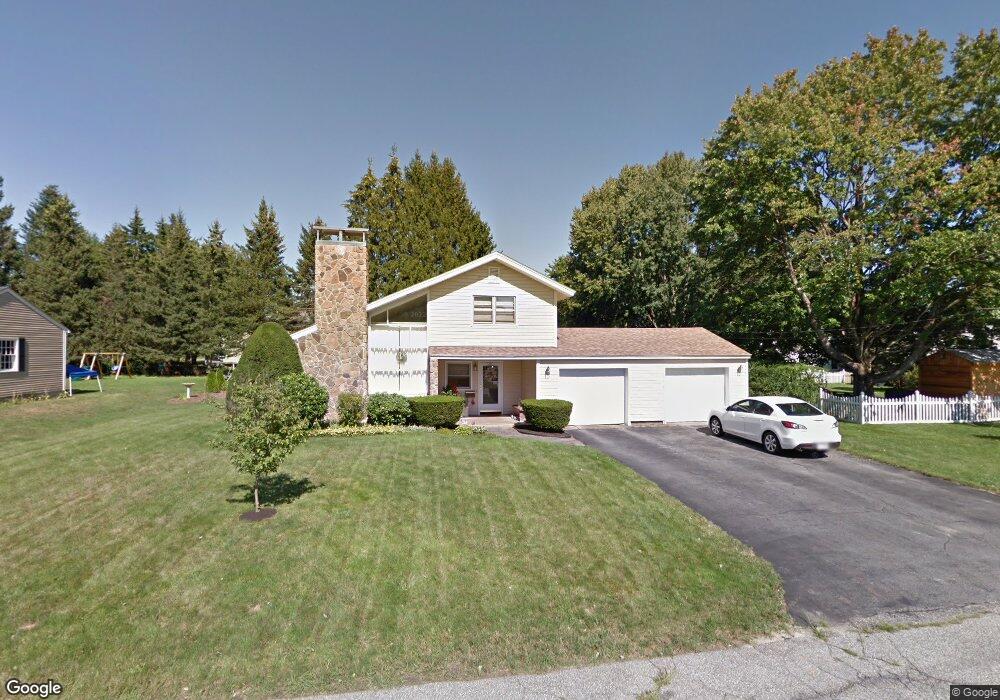
4 Midland St Concord, NH 03301
South End NeighborhoodEstimated Value: $508,804 - $570,000
3
Beds
3
Baths
1,635
Sq Ft
$331/Sq Ft
Est. Value
About This Home
This home is located at 4 Midland St, Concord, NH 03301 and is currently estimated at $541,201, approximately $331 per square foot. 4 Midland St is a home located in Merrimack County with nearby schools including Abbot-Downing School, Rundlett Middle School, and Concord High School.
Ownership History
Date
Name
Owned For
Owner Type
Purchase Details
Closed on
Mar 27, 2020
Sold by
Whitmore Jill M and Whitmore William L
Bought by
Whitmore Ft 2020 and Whitmore
Current Estimated Value
Purchase Details
Closed on
Aug 31, 1992
Bought by
Whitmore William L and Whitmore Jill M
Create a Home Valuation Report for This Property
The Home Valuation Report is an in-depth analysis detailing your home's value as well as a comparison with similar homes in the area
Home Values in the Area
Average Home Value in this Area
Purchase History
| Date | Buyer | Sale Price | Title Company |
|---|---|---|---|
| Whitmore Ft 2020 | -- | None Available | |
| Whitmore William L | $125,000 | -- |
Source: Public Records
Tax History Compared to Growth
Tax History
| Year | Tax Paid | Tax Assessment Tax Assessment Total Assessment is a certain percentage of the fair market value that is determined by local assessors to be the total taxable value of land and additions on the property. | Land | Improvement |
|---|---|---|---|---|
| 2024 | $9,658 | $348,800 | $124,400 | $224,400 |
| 2023 | $9,369 | $348,800 | $124,400 | $224,400 |
| 2022 | $9,030 | $348,800 | $124,400 | $224,400 |
| 2021 | $8,762 | $348,800 | $124,400 | $224,400 |
| 2020 | $7,827 | $292,500 | $97,900 | $194,600 |
| 2019 | $7,109 | $255,900 | $101,500 | $154,400 |
| 2018 | $7,064 | $250,600 | $101,700 | $148,900 |
| 2017 | $6,947 | $246,000 | $101,700 | $144,300 |
| 2016 | $6,677 | $241,300 | $99,900 | $141,400 |
| 2015 | $6,285 | $229,900 | $108,400 | $121,500 |
| 2014 | $6,164 | $229,900 | $108,400 | $121,500 |
| 2013 | $5,689 | $222,400 | $108,400 | $114,000 |
| 2012 | $5,444 | $223,400 | $114,100 | $109,300 |
Source: Public Records
Map
Nearby Homes