4 Ming St Eureka Springs, AR 72632
Estimated Value: $158,481 - $355,000
--
Bed
--
Bath
480
Sq Ft
$542/Sq Ft
Est. Value
About This Home
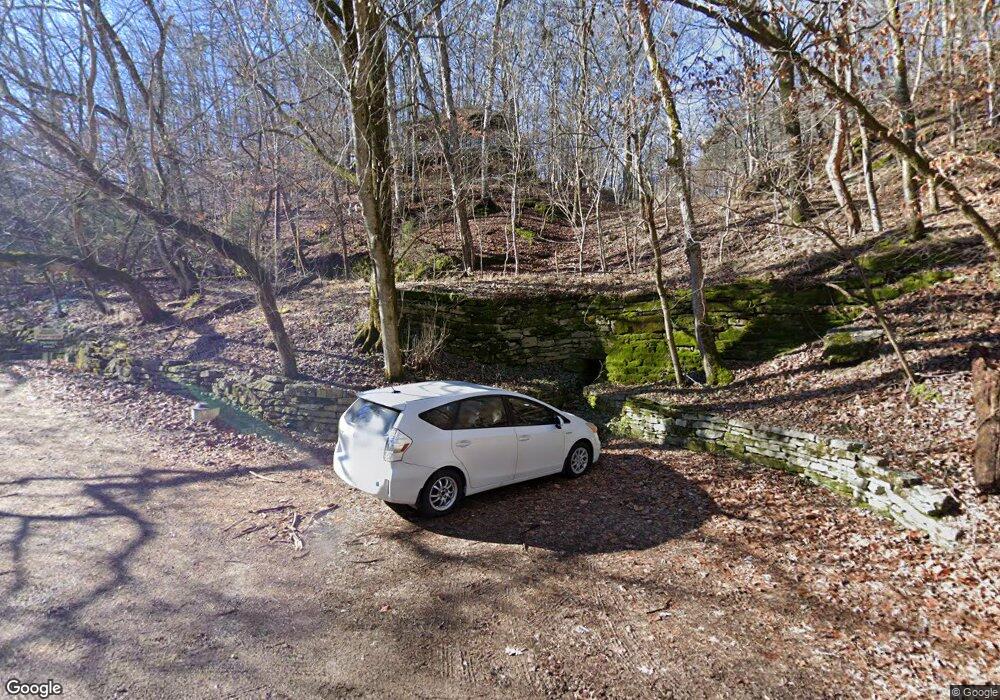
This home is located at 4 Ming St, Eureka Springs, AR 72632 and is currently estimated at $260,370, approximately $542 per square foot. 4 Ming St is a home with nearby schools including Eureka Springs Elementary School, Eureka Springs Middle School, and Eureka Springs High School.
Ownership History
Date
Name
Owned For
Owner Type
Purchase Details
Closed on
Aug 21, 2007
Sold by
Not Provided
Bought by
Gleason Derral
Current Estimated Value
Purchase Details
Closed on
Dec 12, 2005
Sold by
Fulton
Bought by
Gleason
Home Financials for this Owner
Home Financials are based on the most recent Mortgage that was taken out on this home.
Original Mortgage
$99,275
Interest Rate
6.3%
Mortgage Type
New Conventional
Purchase Details
Closed on
Jan 11, 1996
Sold by
Not Provided
Bought by
Not Provided
Create a Home Valuation Report for This Property
The Home Valuation Report is an in-depth analysis detailing your home's value as well as a comparison with similar homes in the area
Home Values in the Area
Average Home Value in this Area
Purchase History
| Date | Buyer | Sale Price | Title Company |
|---|---|---|---|
| Gleason Derral | $100,000 | -- | |
| Gleason Derral | -- | None Available | |
| Gleason | $105,000 | -- | |
| Not Provided | $89,000 | -- |
Source: Public Records
Mortgage History
| Date | Status | Borrower | Loan Amount |
|---|---|---|---|
| Previous Owner | Not Provided | $99,275 |
Source: Public Records
Tax History Compared to Growth
Tax History
| Year | Tax Paid | Tax Assessment Tax Assessment Total Assessment is a certain percentage of the fair market value that is determined by local assessors to be the total taxable value of land and additions on the property. | Land | Improvement |
|---|---|---|---|---|
| 2024 | $903 | $20,840 | $4,500 | $16,340 |
| 2023 | $834 | $20,840 | $4,500 | $16,340 |
| 2022 | $765 | $20,840 | $4,500 | $16,340 |
| 2021 | $696 | $13,760 | $3,750 | $10,010 |
| 2020 | $696 | $13,760 | $3,750 | $10,010 |
| 2019 | $714 | $13,760 | $3,750 | $10,010 |
| 2018 | $714 | $13,760 | $3,750 | $10,010 |
| 2017 | $714 | $13,760 | $3,750 | $10,010 |
| 2016 | $730 | $14,440 | $3,000 | $11,440 |
| 2015 | $730 | $14,440 | $3,000 | $11,440 |
| 2014 | -- | $14,440 | $3,000 | $11,440 |
Source: Public Records
Map
Nearby Homes