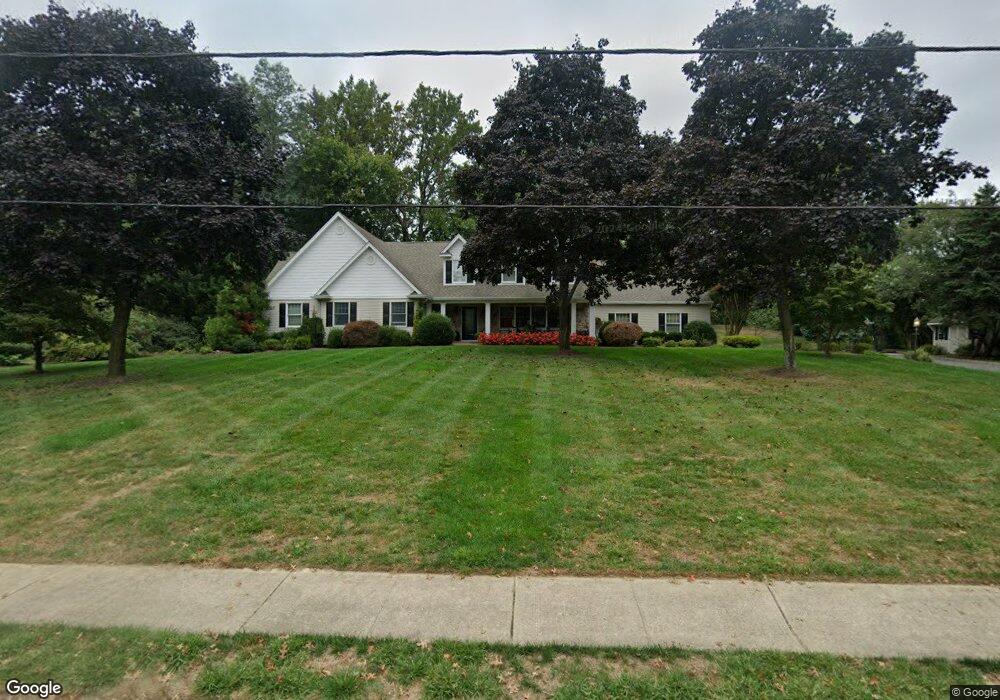
4 Mohican Dr Middletown, NJ 07748
New Monmouth NeighborhoodEstimated Value: $992,000 - $1,304,000
4
Beds
2
Baths
3,036
Sq Ft
$382/Sq Ft
Est. Value
About This Home
This home is located at 4 Mohican Dr, Middletown, NJ 07748 and is currently estimated at $1,159,747, approximately $381 per square foot. 4 Mohican Dr is a home located in Monmouth County with nearby schools including Fairview Elementary School, Bayshore Middle School, and Middletown High School North.
Ownership History
Date
Name
Owned For
Owner Type
Purchase Details
Closed on
Apr 30, 2007
Sold by
Green Jeffrey H and Green Ralone H
Bought by
Inghilleri Anthony and Inghilleri Susan
Current Estimated Value
Home Financials for this Owner
Home Financials are based on the most recent Mortgage that was taken out on this home.
Original Mortgage
$200,000
Interest Rate
6.74%
Mortgage Type
Purchase Money Mortgage
Purchase Details
Closed on
Oct 16, 2000
Sold by
Macdonald Joseph
Bought by
Green Jeffrey and Ralone Green
Home Financials for this Owner
Home Financials are based on the most recent Mortgage that was taken out on this home.
Original Mortgage
$386,750
Interest Rate
7.83%
Mortgage Type
Purchase Money Mortgage
Purchase Details
Closed on
Feb 3, 1998
Sold by
D'Amore Anna
Bought by
Macdonald Joseph and Alexander Catherine
Create a Home Valuation Report for This Property
The Home Valuation Report is an in-depth analysis detailing your home's value as well as a comparison with similar homes in the area
Home Values in the Area
Average Home Value in this Area
Purchase History
| Date | Buyer | Sale Price | Title Company |
|---|---|---|---|
| Inghilleri Anthony | $785,000 | Multiple | |
| Green Jeffrey | $455,000 | -- | |
| Macdonald Joseph | $315,000 | -- |
Source: Public Records
Mortgage History
| Date | Status | Borrower | Loan Amount |
|---|---|---|---|
| Open | Inghilleri Anthony | $100,000 | |
| Previous Owner | Inghilleri Anthony | $200,000 | |
| Previous Owner | Green Jeffrey | $386,750 |
Source: Public Records
Tax History Compared to Growth
Tax History
| Year | Tax Paid | Tax Assessment Tax Assessment Total Assessment is a certain percentage of the fair market value that is determined by local assessors to be the total taxable value of land and additions on the property. | Land | Improvement |
|---|---|---|---|---|
| 2025 | $14,833 | $971,700 | $425,000 | $546,700 |
| 2024 | $14,156 | $901,700 | $365,000 | $536,700 |
| 2023 | $14,156 | $814,500 | $338,000 | $476,500 |
| 2022 | $14,011 | $723,700 | $270,000 | $453,700 |
| 2021 | $14,011 | $673,600 | $270,000 | $403,600 |
| 2020 | $14,207 | $664,500 | $270,000 | $394,500 |
| 2019 | $13,986 | $662,200 | $270,000 | $392,200 |
| 2018 | $13,953 | $643,900 | $270,000 | $373,900 |
| 2017 | $12,370 | $582,400 | $270,000 | $312,400 |
| 2016 | $12,839 | $602,500 | $300,000 | $302,500 |
| 2015 | $12,765 | $597,600 | $300,000 | $297,600 |
| 2014 | $12,521 | $572,000 | $300,000 | $272,000 |
Source: Public Records
Map
Nearby Homes
- 561 Kings Hwy E
- 2 Constitution Dr
- 4 Runyon Rd
- 2 Pomo Ct
- 35 Fairview Dr
- 43 Valiant Ct
- 31 Valiant Ct
- 22 Edmund Way
- 7 Meehan Ct
- 6 Waller Dr
- 64 Augustus Dr
- 22 Waller Dr
- 16 Waller Dr
- 58 Edmund Way
- Hartshorne Plan at Middletown Walk
- 10 Waller Dr
- 152 Chapel Hill Rd
- 78 Crestview Dr
- 3504 James Ct Unit 159
- 15 Kennedy Ct Unit 86