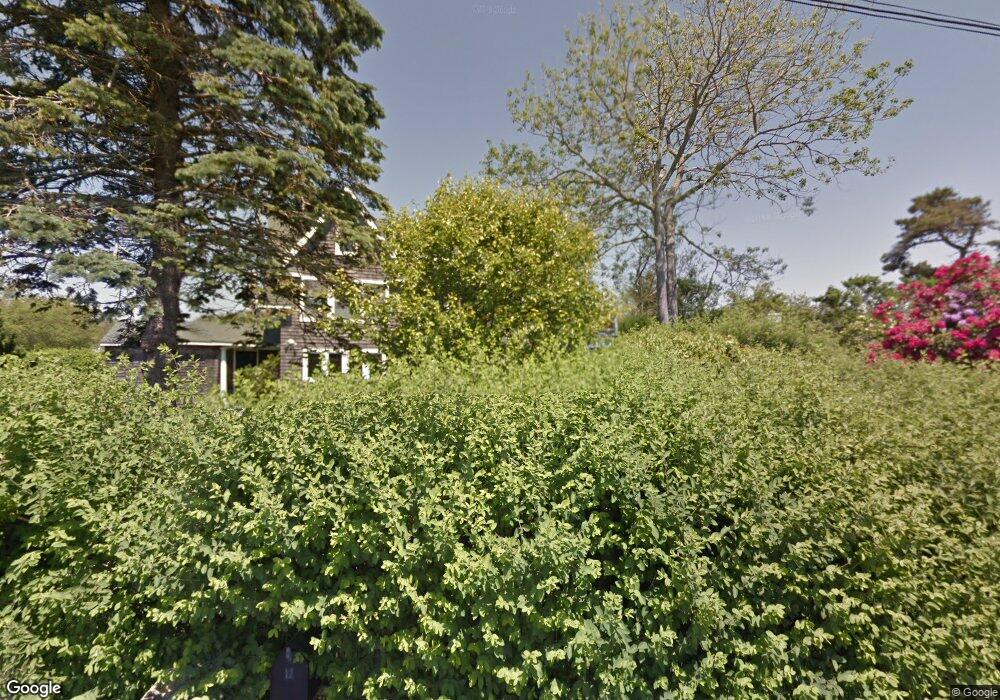
4 Neptune Ave Charlestown, RI 02813
Estimated Value: $1,321,000 - $2,345,000
3
Beds
1
Bath
950
Sq Ft
$2,026/Sq Ft
Est. Value
About This Home
This home is located at 4 Neptune Ave, Charlestown, RI 02813 and is currently estimated at $1,924,912, approximately $2,026 per square foot. 4 Neptune Ave is a home located in Washington County with nearby schools including Chariho Regional Middle School and Chariho High School.
Ownership History
Date
Name
Owned For
Owner Type
Purchase Details
Closed on
Apr 22, 2020
Sold by
Daniels Jeffrey and Miller Katherine K
Bought by
Jeffrey Daniels Ret
Current Estimated Value
Purchase Details
Closed on
Nov 30, 1998
Sold by
Luikart Joan S
Bought by
Daniels Jeffrey and Miller Katharine K
Home Financials for this Owner
Home Financials are based on the most recent Mortgage that was taken out on this home.
Original Mortgage
$95,000
Interest Rate
6.83%
Create a Home Valuation Report for This Property
The Home Valuation Report is an in-depth analysis detailing your home's value as well as a comparison with similar homes in the area
Home Values in the Area
Average Home Value in this Area
Purchase History
| Date | Buyer | Sale Price | Title Company |
|---|---|---|---|
| Jeffrey Daniels Ret | -- | None Available | |
| Daniels Jeffrey | $285,000 | -- |
Source: Public Records
Mortgage History
| Date | Status | Borrower | Loan Amount |
|---|---|---|---|
| Previous Owner | Daniels Jeffrey | $95,000 |
Source: Public Records
Tax History Compared to Growth
Tax History
| Year | Tax Paid | Tax Assessment Tax Assessment Total Assessment is a certain percentage of the fair market value that is determined by local assessors to be the total taxable value of land and additions on the property. | Land | Improvement |
|---|---|---|---|---|
| 2025 | $9,527 | $1,606,500 | $1,183,400 | $423,100 |
| 2024 | $9,286 | $1,606,500 | $1,183,400 | $423,100 |
| 2023 | $9,221 | $1,606,500 | $1,183,400 | $423,100 |
| 2022 | $8,158 | $998,500 | $738,000 | $260,500 |
| 2021 | $8,168 | $998,500 | $738,000 | $260,500 |
| 2020 | $8,218 | $998,500 | $738,000 | $260,500 |
| 2019 | $8,386 | $908,600 | $693,300 | $215,300 |
| 2018 | $8,759 | $908,600 | $693,300 | $215,300 |
| 2017 | $8,713 | $908,600 | $693,300 | $215,300 |
| 2016 | $8,074 | $790,800 | $569,200 | $221,600 |
| 2015 | $7,995 | $790,800 | $569,200 | $221,600 |
| 2014 | $7,829 | $790,800 | $569,200 | $221,600 |
Source: Public Records
Map
Nearby Homes