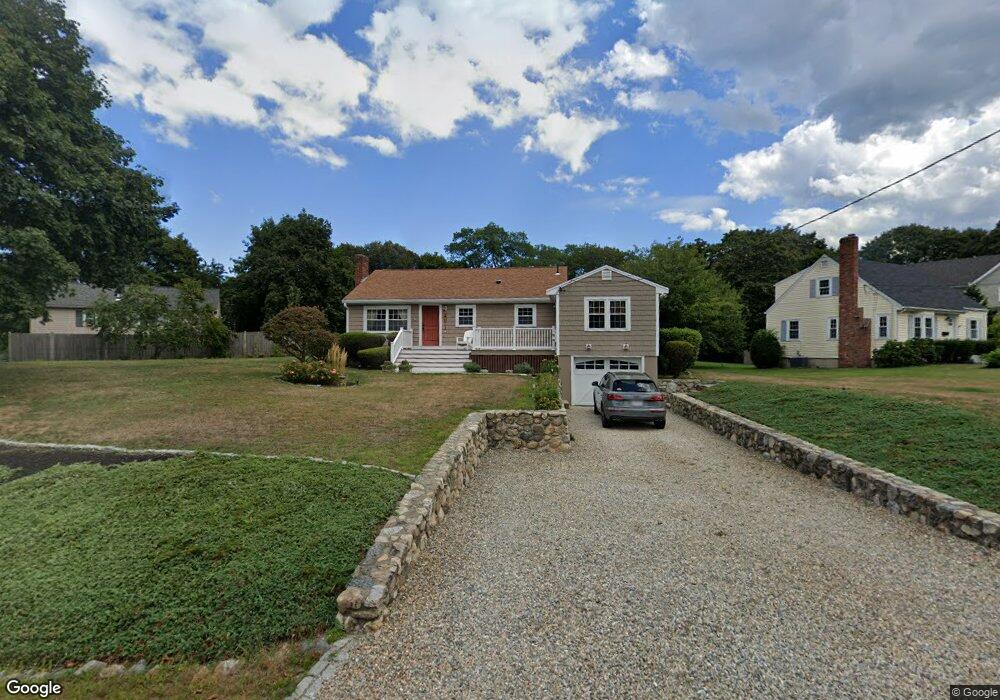
4 Newbridge St Hingham, MA 02043
Estimated Value: $737,000 - $827,000
2
Beds
1
Bath
1,222
Sq Ft
$631/Sq Ft
Est. Value
About This Home
This home is located at 4 Newbridge St, Hingham, MA 02043 and is currently estimated at $771,611, approximately $631 per square foot. 4 Newbridge St is a home located in Plymouth County with nearby schools including Plymouth River Elementary School, Hingham Middle School, and Hingham High School.
Ownership History
Date
Name
Owned For
Owner Type
Purchase Details
Closed on
May 2, 2006
Sold by
Kessener Gary D
Bought by
Sampson Mark D and Devito Daniela
Current Estimated Value
Purchase Details
Closed on
Sep 29, 2000
Sold by
Hawley Richard J and Hawley Jennifer A
Bought by
Kessener Gary and Kessener Noo Aew
Purchase Details
Closed on
Dec 12, 1997
Sold by
Kent David K and Kent Linda M
Bought by
Hawley Richard J
Purchase Details
Closed on
Jul 15, 1994
Sold by
Damstra James D and Damstra Bertha L
Bought by
Kent David K and Kent Linda M
Create a Home Valuation Report for This Property
The Home Valuation Report is an in-depth analysis detailing your home's value as well as a comparison with similar homes in the area
Purchase History
We collect this data history from publicly available records. To have your information removed, we recommend requesting removal directly through your county’s website.
| Date | Buyer | Sale Price | Title Company |
|---|---|---|---|
| Sampson Mark D | $389,000 | -- | |
| Kessener Gary | $317,900 | -- | |
| Hawley Richard J | $182,000 | -- | |
| Kent David K | $157,000 | -- |
Source: Public Records
Mortgage History
We collect this data history from publicly available records. To have your information removed, we recommend requesting removal directly through your county’s website.
| Date | Status | Borrower | Loan Amount |
|---|---|---|---|
| Open | Kent David K | $313,000 | |
| Closed | Kent David K | $25,000 |
Source: Public Records
Tax History
| Year | Tax Paid | Tax Assessment Tax Assessment Total Assessment is a certain percentage of the fair market value that is determined by local assessors to be the total taxable value of land and additions on the property. | Land | Improvement |
|---|---|---|---|---|
| 2025 | $6,327 | $591,900 | $337,100 | $254,800 |
| 2024 | $6,212 | $572,500 | $337,100 | $235,400 |
| 2023 | $5,415 | $541,500 | $313,000 | $228,500 |
| 2022 | $5,133 | $444,000 | $272,900 | $171,100 |
| 2021 | $5,021 | $425,500 | $272,900 | $152,600 |
| 2020 | $4,906 | $425,500 | $272,900 | $152,600 |
| 2019 | $4,931 | $417,500 | $272,900 | $144,600 |
| 2018 | $6,875 | $401,600 | $272,900 | $128,700 |
| 2017 | $5,060 | $413,100 | $280,900 | $132,200 |
| 2016 | $4,994 | $399,800 | $267,600 | $132,200 |
| 2015 | $4,622 | $368,900 | $236,700 | $132,200 |
Source: Public Records
Map
Nearby Homes
- 156 Fort Hill St
- 1 Brewer Way
- 6 Adams Ct
- 191 South St
- 198 South St Unit A
- 190 South St Unit A
- 246 North St
- 182 South St
- 117 Hobart St
- 51 Elm St
- 3302 Tuckers Ln
- 30 Manatee Rd
- 3502 Tuckers Ln Unit 3502
- 16 Rhodes Place
- 21 French St
- 403 Tuckers Ln Unit 403
- 54 Lincoln St
- 106 Central St
- 431 Main St
- 2 Beal's Cove Rd Unit F
- 96 Fort Hill St
- 8 Newbridge St
- 92 Fort Hill St
- 92 Fort Hill St Unit R
- 90 Fort Hill St
- 12 Newbridge St
- 12 Newbridge St Unit 1
- 7 Newbridge St
- 106 Fort Hill St
- 106 Fort Hill St
- 88 Fort Hill St
- 11 Newbridge St
- 99 Fort Hill St
- 2 Charles Everett Way
- 103 Fort Hill St
- 107 Fort Hill St
- 18 Newbridge St
- 111 Fort Hill St
- 1 Charles Everett Way
- 4 Charles Everett Way
Your Personal Tour Guide
Ask me questions while you tour the home.